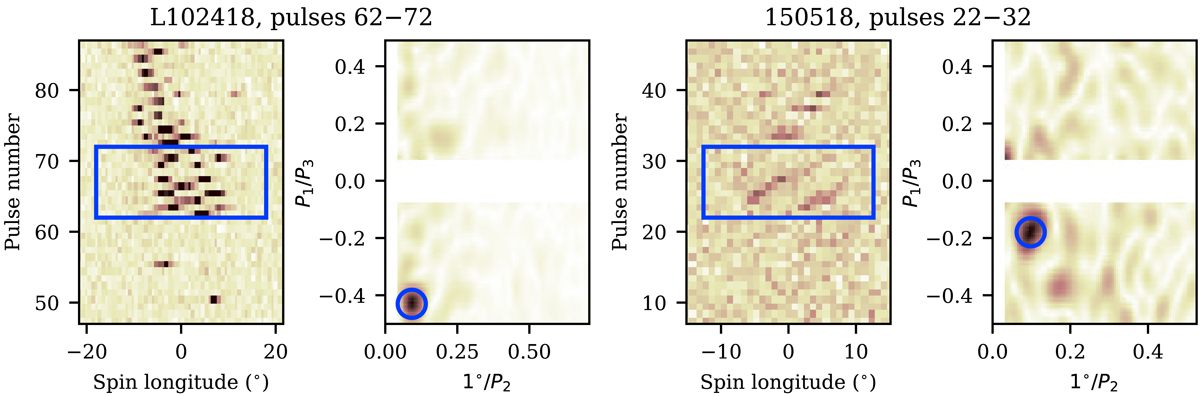
Fig. 4.
Download original image
Example of a 2D (spin longitude vs. pulse number) FFT spectrum featuring the Tb mode of session L102418 (left) and the Tq mode of session 150518 (right). The Fourier transform was taken from the region enclosed in the blue rectangle in the left-side pulse sequence plot. Frequencies close to zero were eliminated from the analysis to reduce the influence of red noise on the peak-finding algorithm. The color-bar range in each figure is set by the local minimum and maximum and is not uniform across different LRF spectra.
Current usage metrics show cumulative count of Article Views (full-text article views including HTML views, PDF and ePub downloads, according to the available data) and Abstracts Views on Vision4Press platform.
Data correspond to usage on the plateform after 2015. The current usage metrics is available 48-96 hours after online publication and is updated daily on week days.
Initial download of the metrics may take a while.