Open Access
Fig. 3.
Download original image
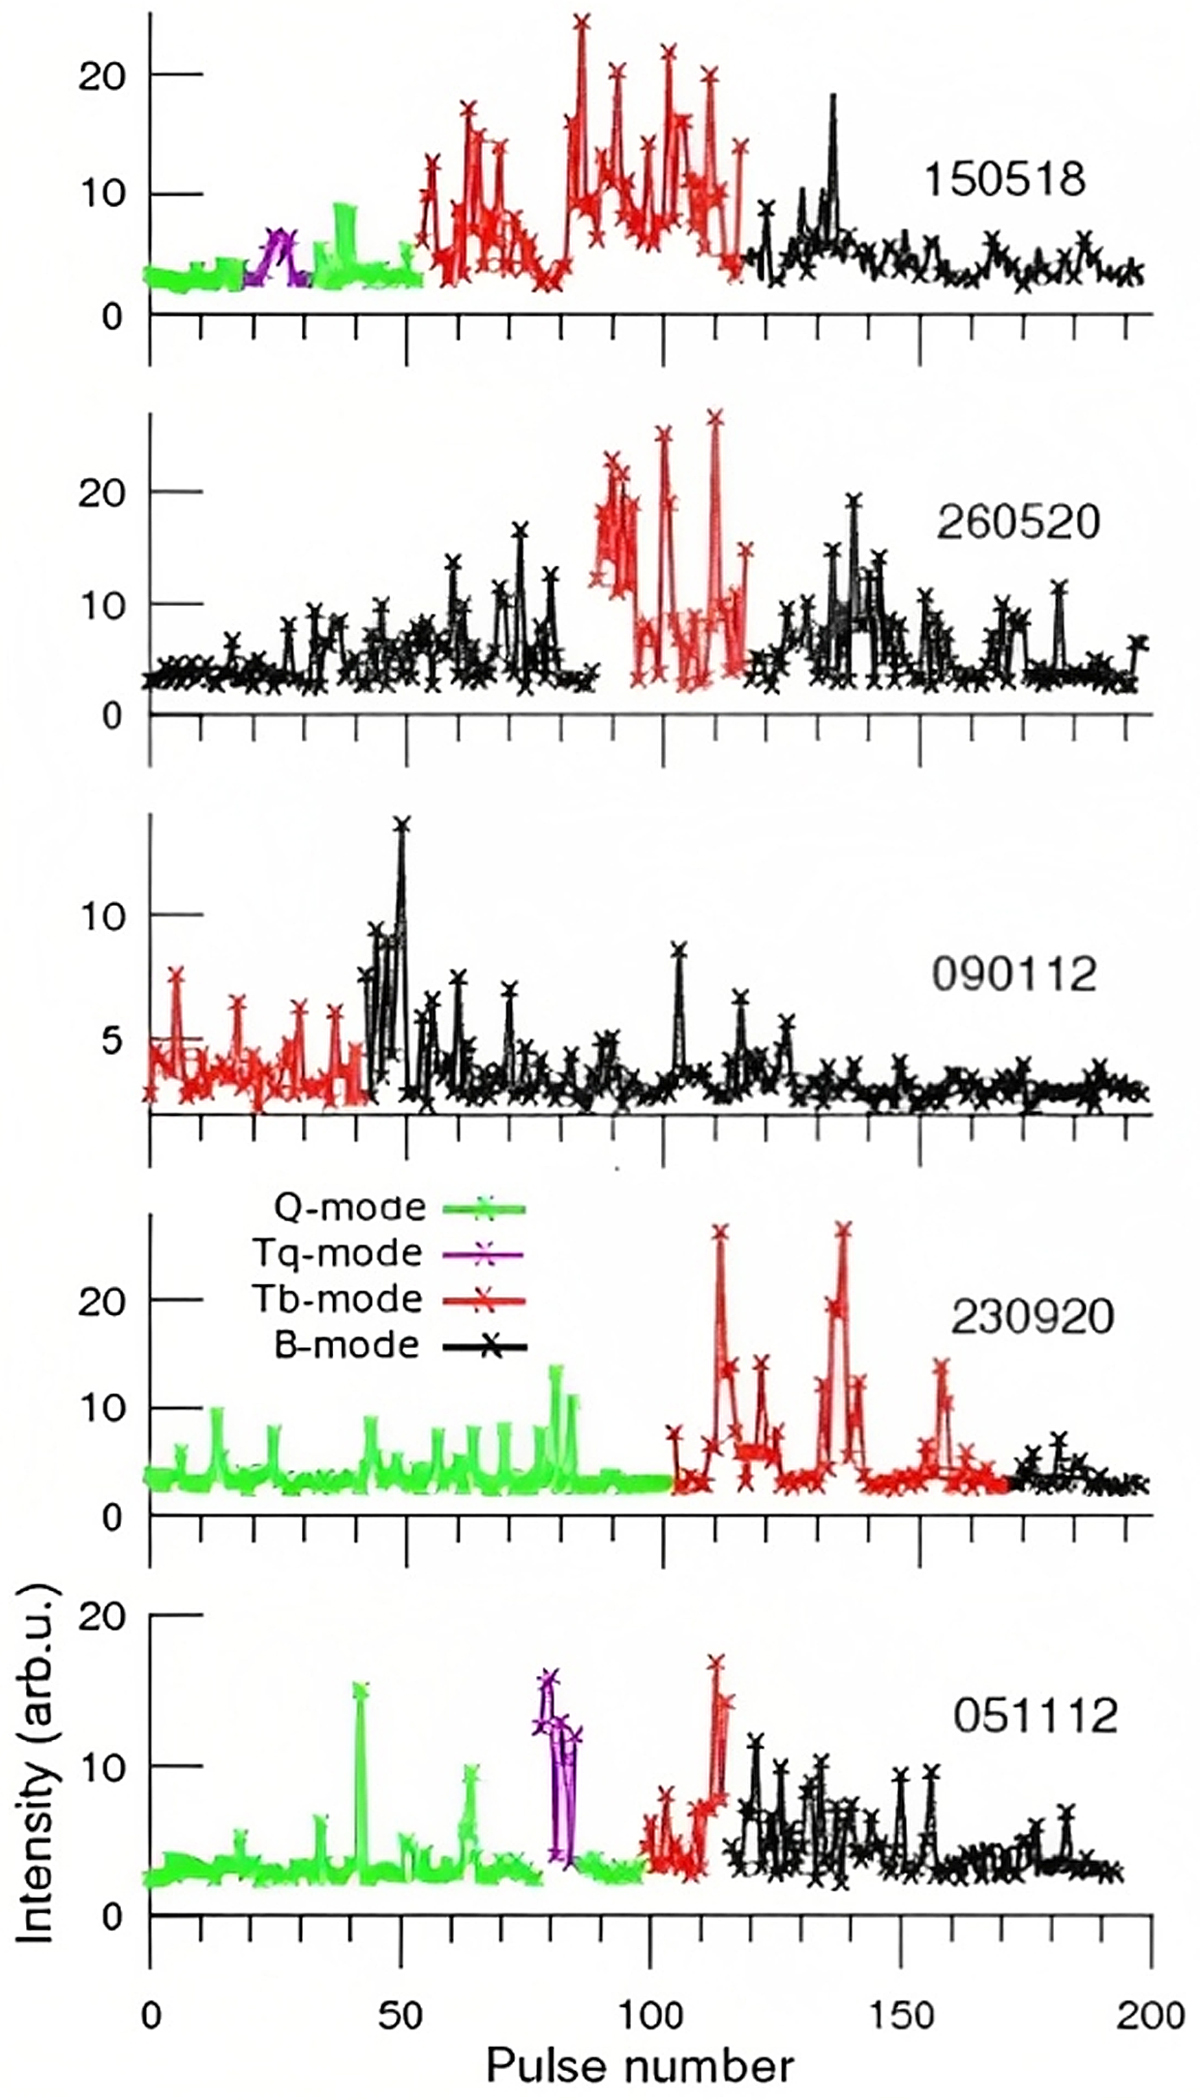
Five records of Q-to-B mode switches from the archives of 112 MHz observations. The intensity of subpulses in units of S/N is given as a function of pulse number. Individual modes are highlighted with different colors (black for B mode, green for Q mode, red for Tb mode, and magenta for Tq mode).
Current usage metrics show cumulative count of Article Views (full-text article views including HTML views, PDF and ePub downloads, according to the available data) and Abstracts Views on Vision4Press platform.
Data correspond to usage on the plateform after 2015. The current usage metrics is available 48-96 hours after online publication and is updated daily on week days.
Initial download of the metrics may take a while.