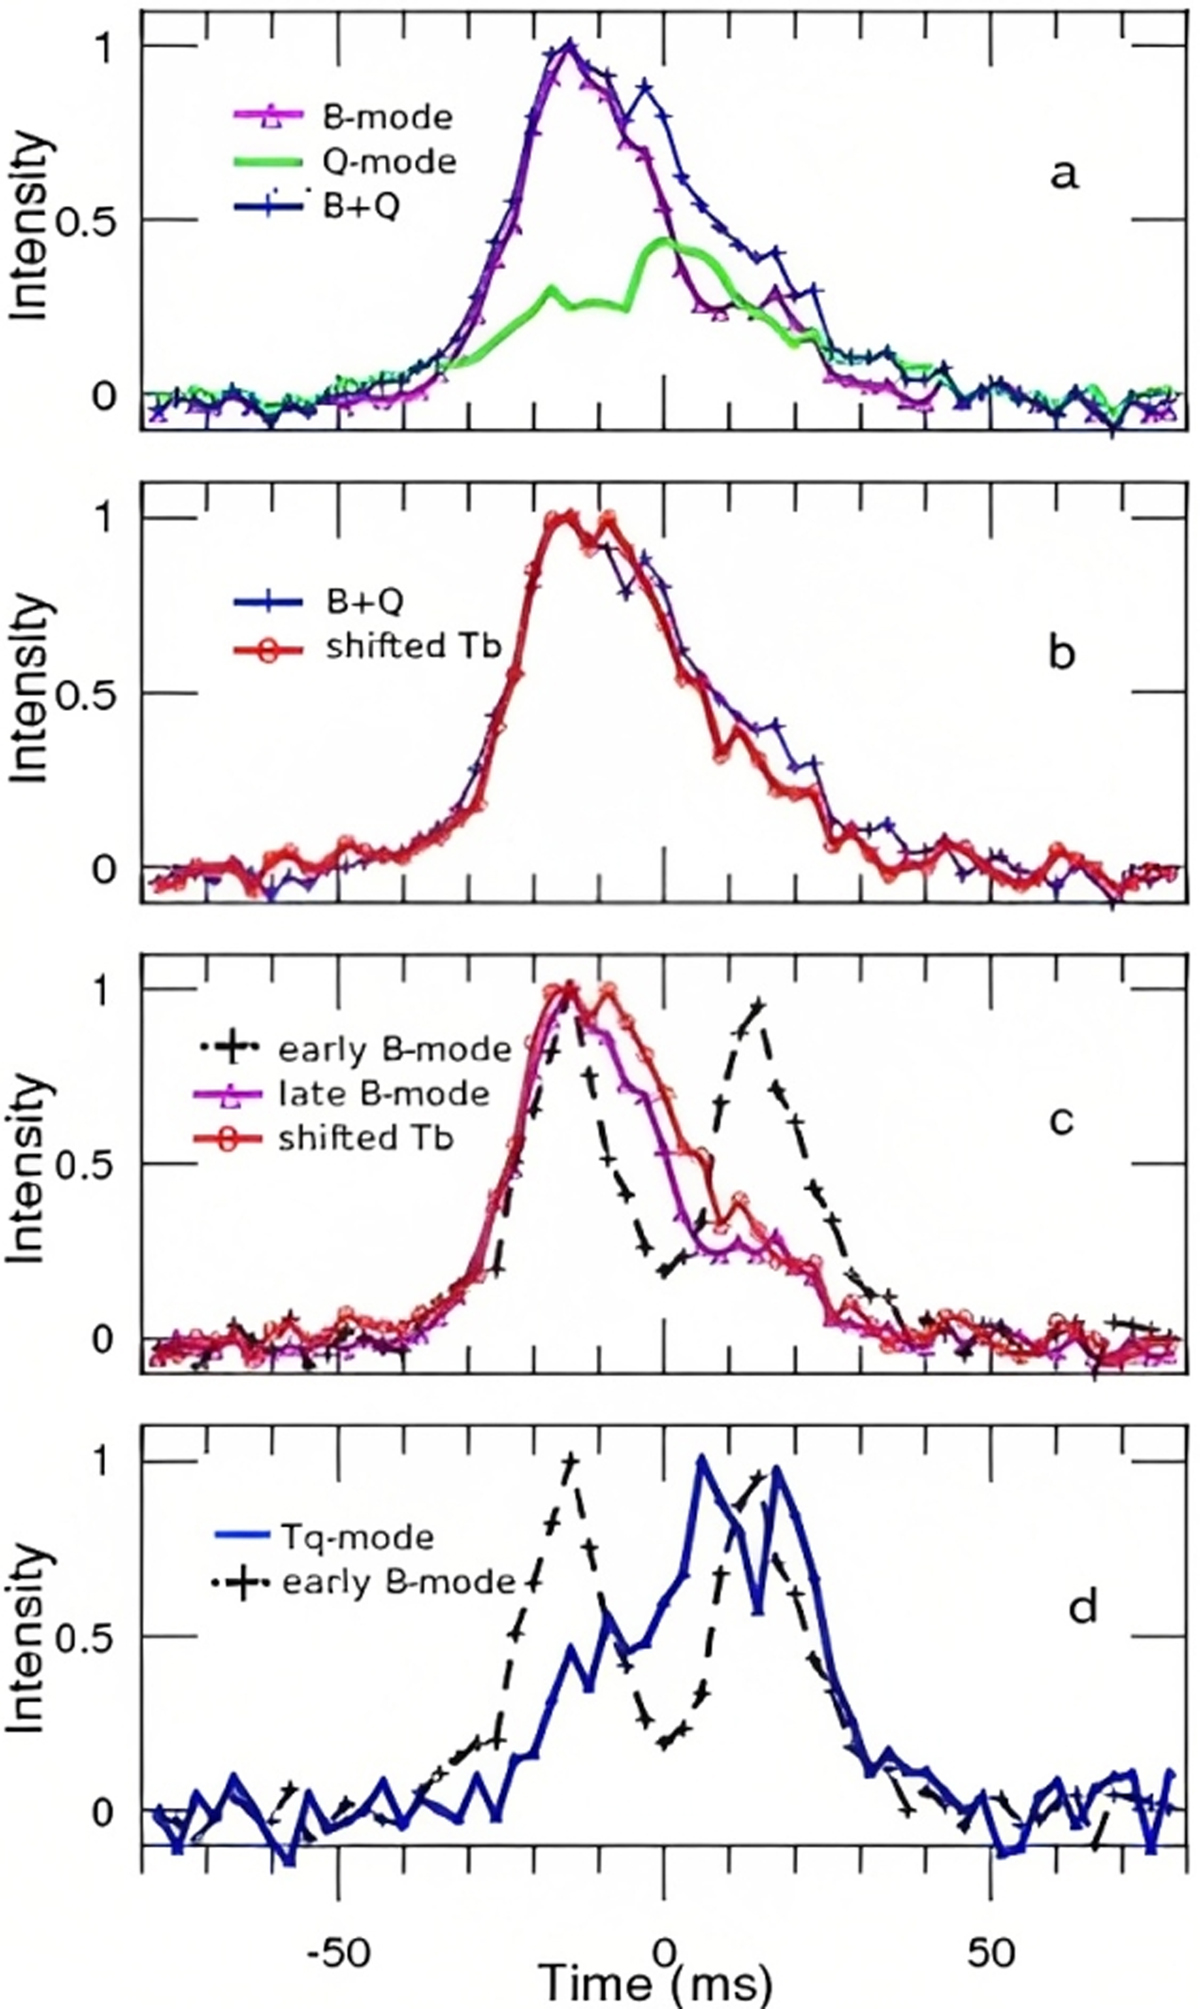
Fig. 10.
Download original image
Comparison of the mode-separated average profile shapes for observations at 112 MHz. (a) Mode-separated average profiles for session 221219, where the B-to-Q transition occurred in the middle of the observation. Violet and green lines correspond to the B and Q modes, respectively, and the thin blue line shows the composite B + Q profile. (b)B + Q profile (blue line) superposed on the average Tb-mode pulse profile (red line) shifted by 5.7 ms toward earlier spin longitudes. (c)B-mode pulse shape evolution starting from its onset (session 260520, dotted line) up to cessation (session 221219, violet line), together with Tb-mode pulse (red line) shifted by 5.7 ms toward earlier spin longitudes. (d) Tq-mode profile (blue line) accumulated from sessions 150518 and 051112. The B-mode profile in 260520 is given for comparison. Profiles for different days were aligned by the leading peak of the B-mode profile.
Current usage metrics show cumulative count of Article Views (full-text article views including HTML views, PDF and ePub downloads, according to the available data) and Abstracts Views on Vision4Press platform.
Data correspond to usage on the plateform after 2015. The current usage metrics is available 48-96 hours after online publication and is updated daily on week days.
Initial download of the metrics may take a while.