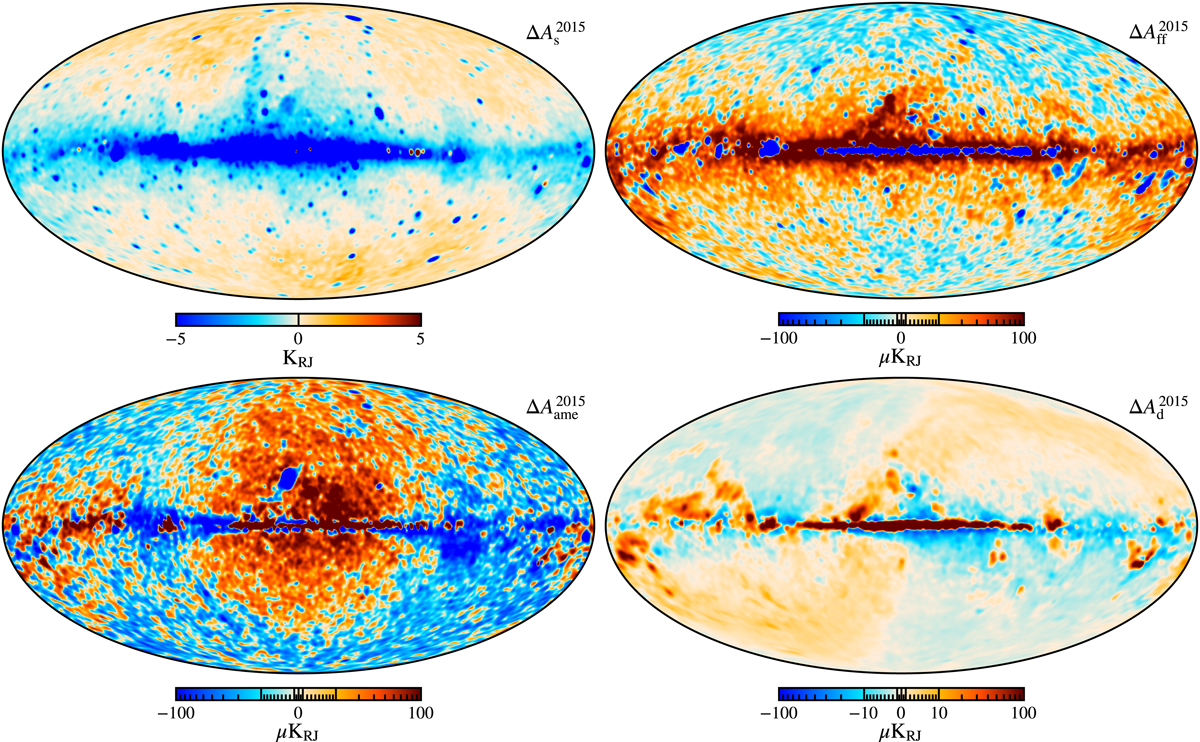
Fig. 22.
Download original image
Difference maps between the component amplitude maps derived in BEYONDPLANCK and the Planck 2015 analysis, for synchrotron (top-left), free-free (top-right), AME (bottom-left), and thermal dust emission (bottom-right), respectively. All maps have been smoothed to a common angular resolution of 2° FWHM, a relative offset has been fitted and subtracted using the frequency-band monopole mask discussed in Sect. 4.3 and differences in reference frequencies (where relevant) have been accounted for by a single multiplicative scaling factor.
Current usage metrics show cumulative count of Article Views (full-text article views including HTML views, PDF and ePub downloads, according to the available data) and Abstracts Views on Vision4Press platform.
Data correspond to usage on the plateform after 2015. The current usage metrics is available 48-96 hours after online publication and is updated daily on week days.
Initial download of the metrics may take a while.