Fig. 15.
Download original image
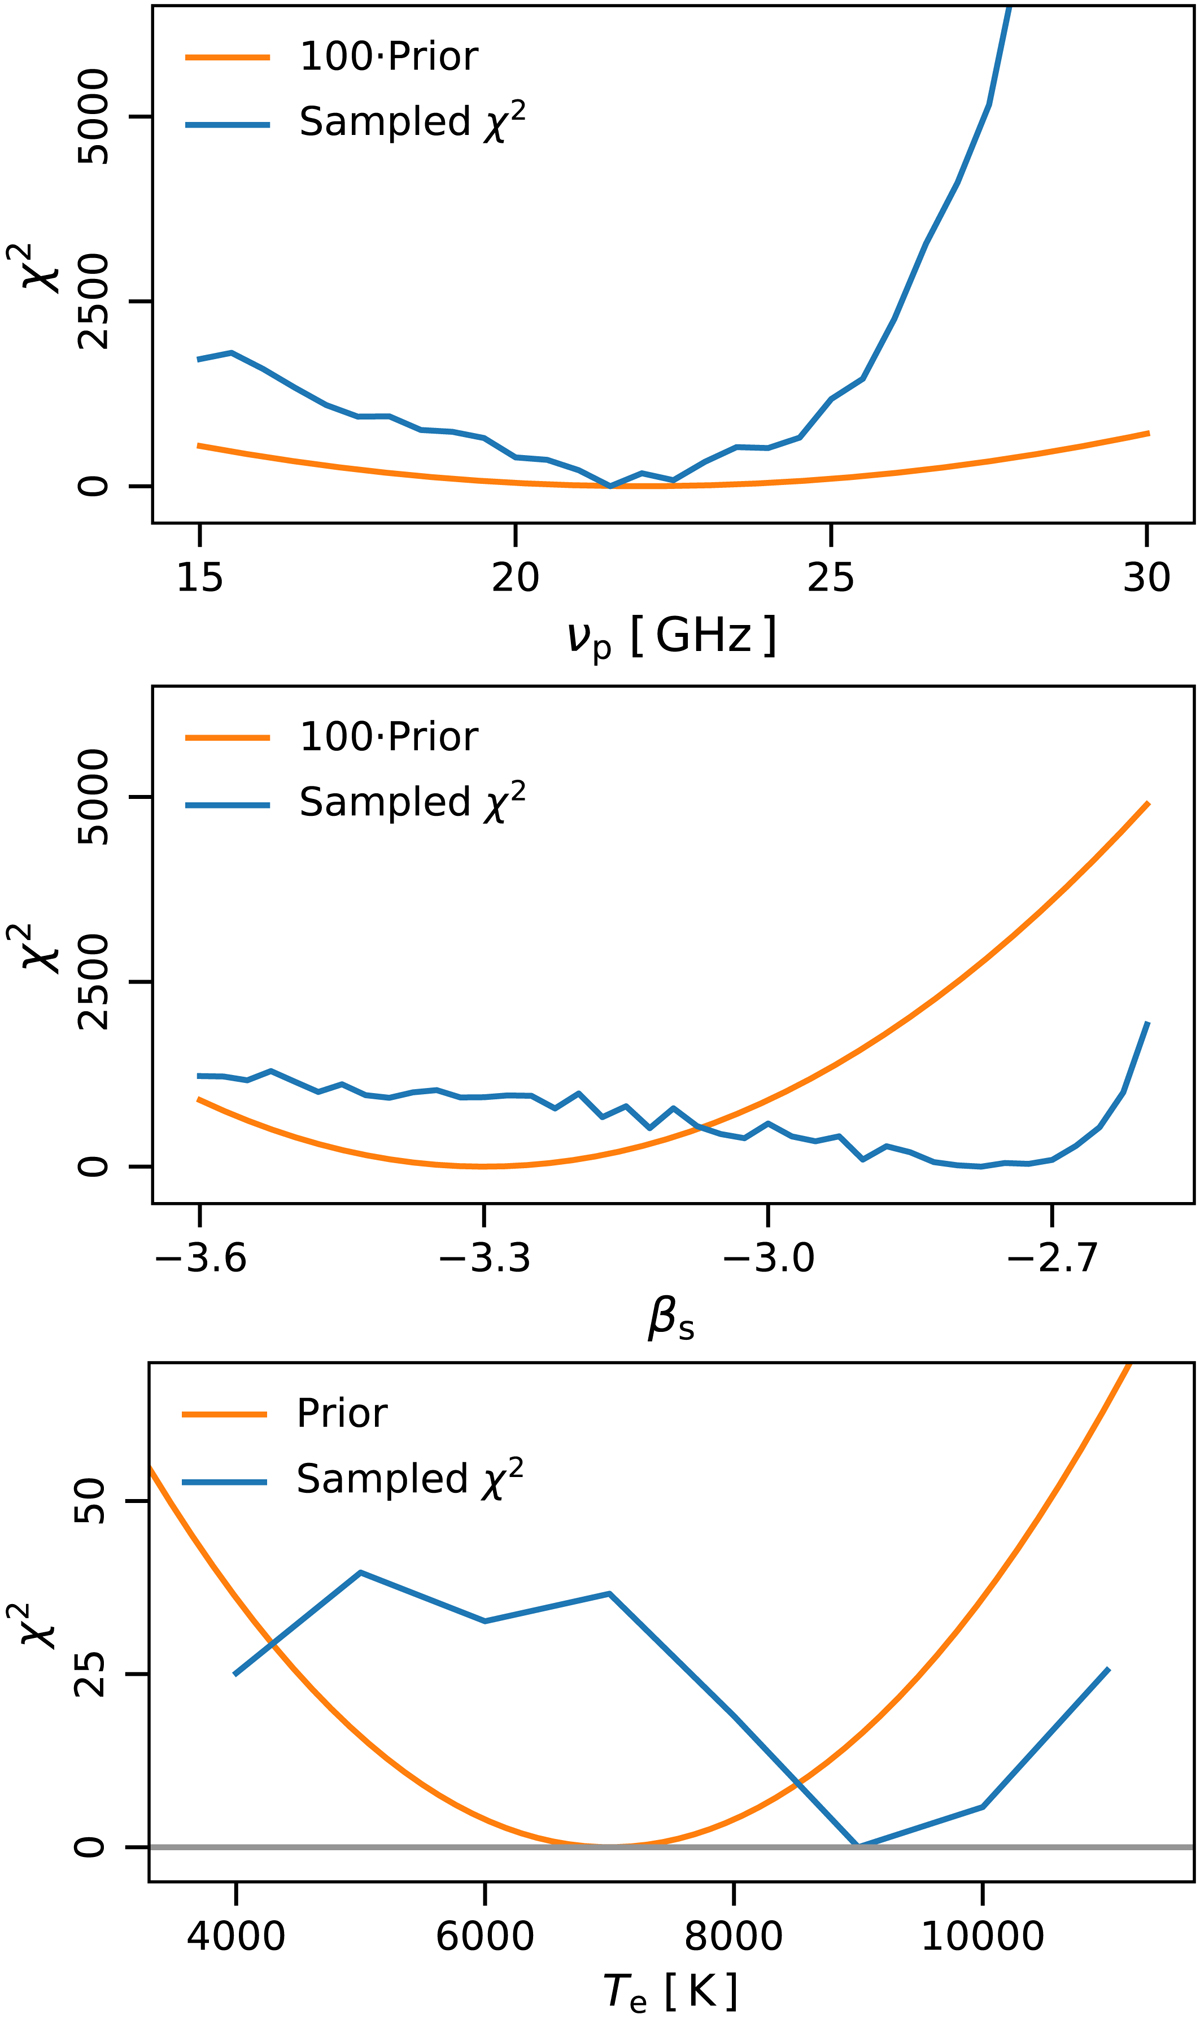
χ2 distributions (blue curves) from coarse grid evaluation of each free spectral parameters. From top to bottom, the panels show (1) AME peak frequency, νp; (2) synchrotron spectral index, βs; and (3) free-free electron temperature, Te. The minimum χ2 value for each parameter has been subtracted in each case. Orange curves show the priors adopted for the given component; see Table 1. The prior values for βs and νp have been scaled by a factor of 100 to fit in the plot with the derived χ2 values.
Current usage metrics show cumulative count of Article Views (full-text article views including HTML views, PDF and ePub downloads, according to the available data) and Abstracts Views on Vision4Press platform.
Data correspond to usage on the plateform after 2015. The current usage metrics is available 48-96 hours after online publication and is updated daily on week days.
Initial download of the metrics may take a while.