Fig. 4.
Download original image
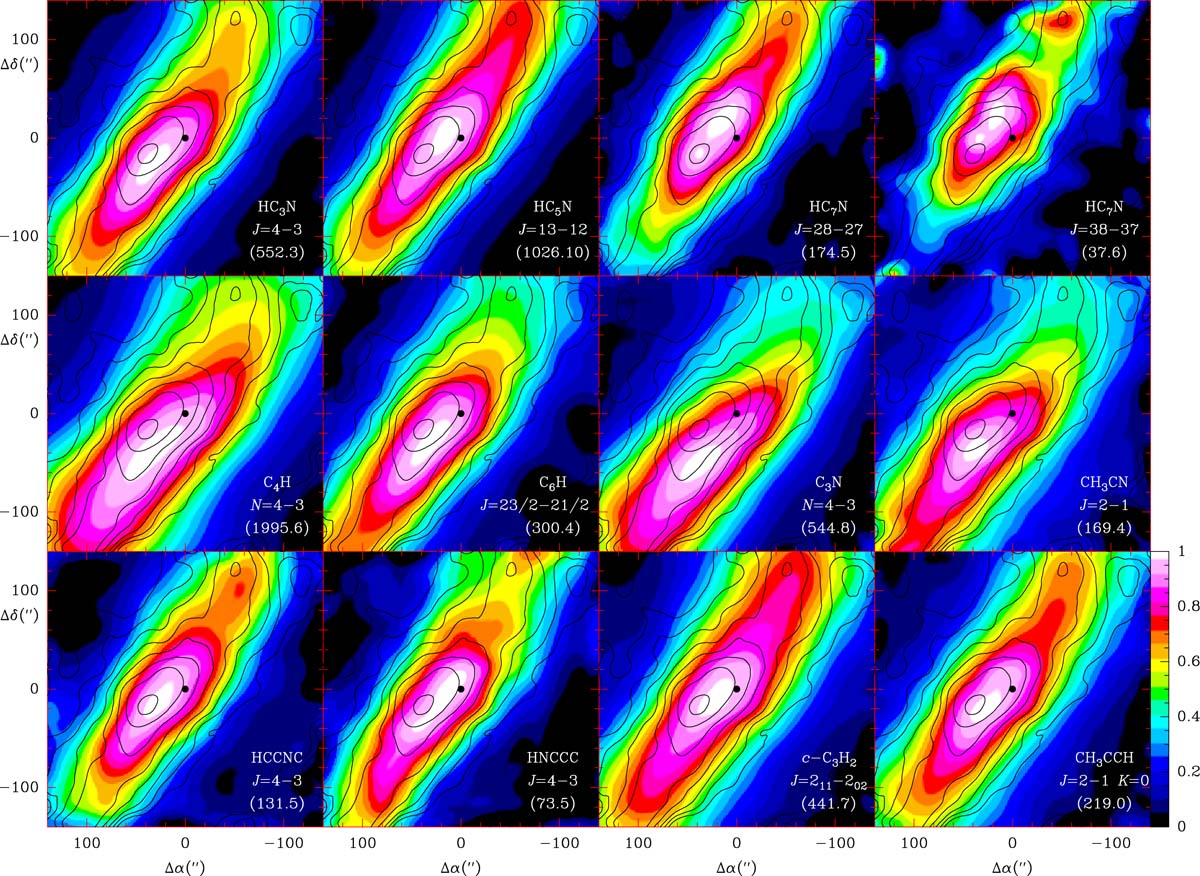
Integrated intensity between 5.3 and 6.5 km s−1 of different molecular transitions (colours) compared with that of C6H5CN (black contours; first contour and step are 0.75 mK km s−1). For each molecular transition the integrated intensity has been normalised to the maximum value within the area covered by the map. The colour scale (bottom right) is the same for all molecular transitions. The molecule, transition, and maximum intensity (shown in brackets) are indicated in the bottom right corner of each panel. The black dot corresponds to the centre of the map.
Current usage metrics show cumulative count of Article Views (full-text article views including HTML views, PDF and ePub downloads, according to the available data) and Abstracts Views on Vision4Press platform.
Data correspond to usage on the plateform after 2015. The current usage metrics is available 48-96 hours after online publication and is updated daily on week days.
Initial download of the metrics may take a while.