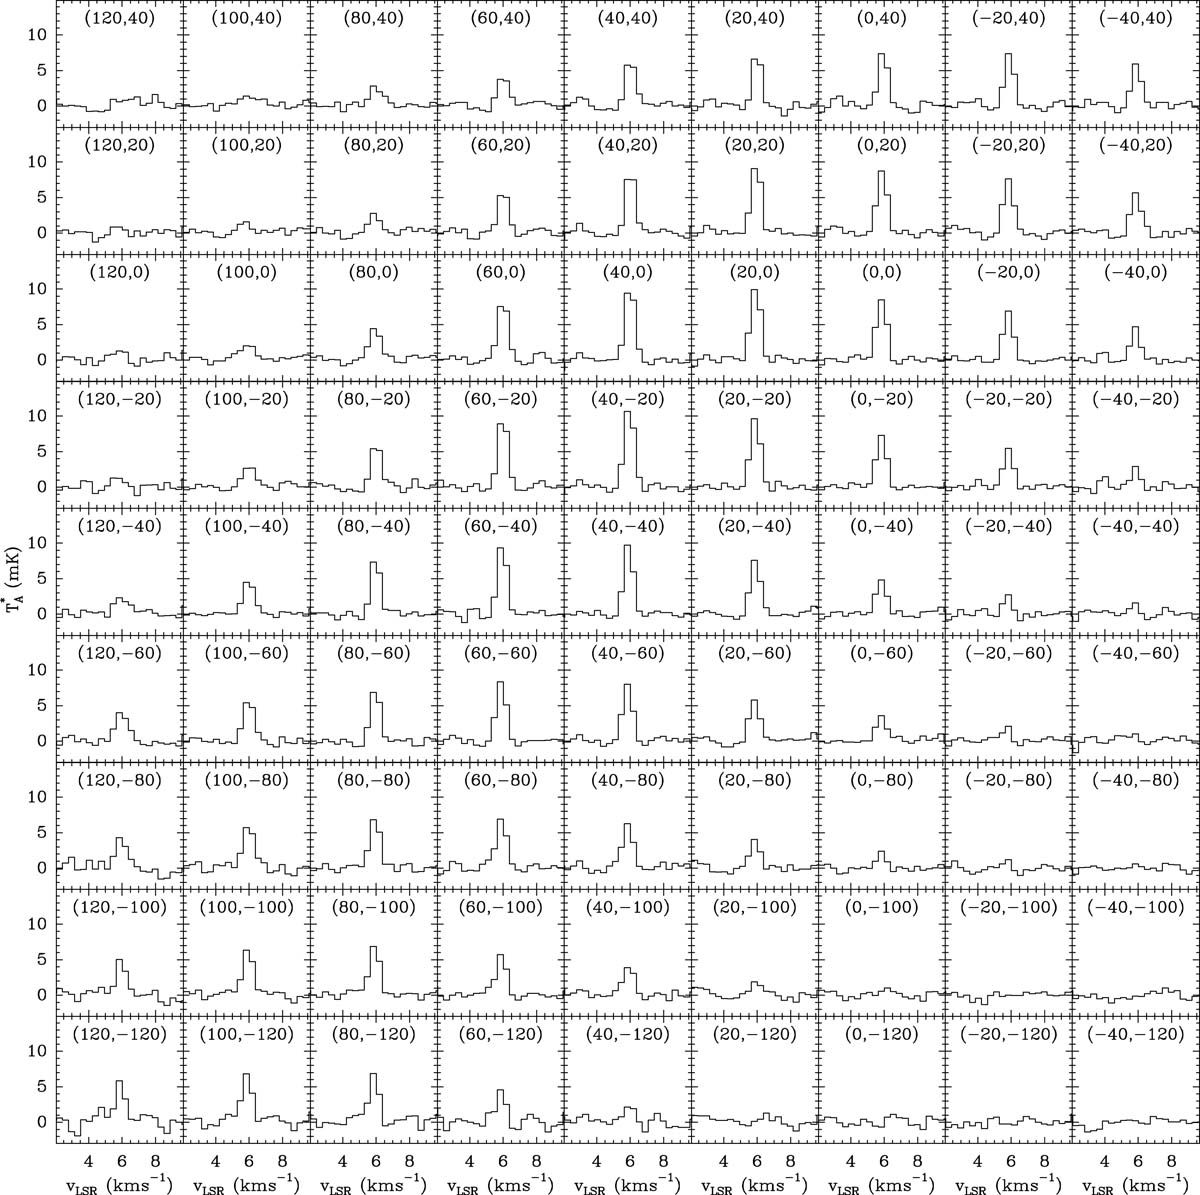
Fig. 1.
Download original image
Stacked line of C6H5CN obtained from the average in each position of 52 individual lines (see Appendix B). Only the spectra around the region of maximum emission (see Fig. 2) are shown. The offset positions in arcseconds are indicated in each panel. The abscissa in each panel corresponds to the local standard of rest velocity of the stacked data (in km s−1). The intensity scale corresponds to the antenna temperature corrected for atmospheric transmission and antenna losses.
Current usage metrics show cumulative count of Article Views (full-text article views including HTML views, PDF and ePub downloads, according to the available data) and Abstracts Views on Vision4Press platform.
Data correspond to usage on the plateform after 2015. The current usage metrics is available 48-96 hours after online publication and is updated daily on week days.
Initial download of the metrics may take a while.