Fig. A.2.
Download original image
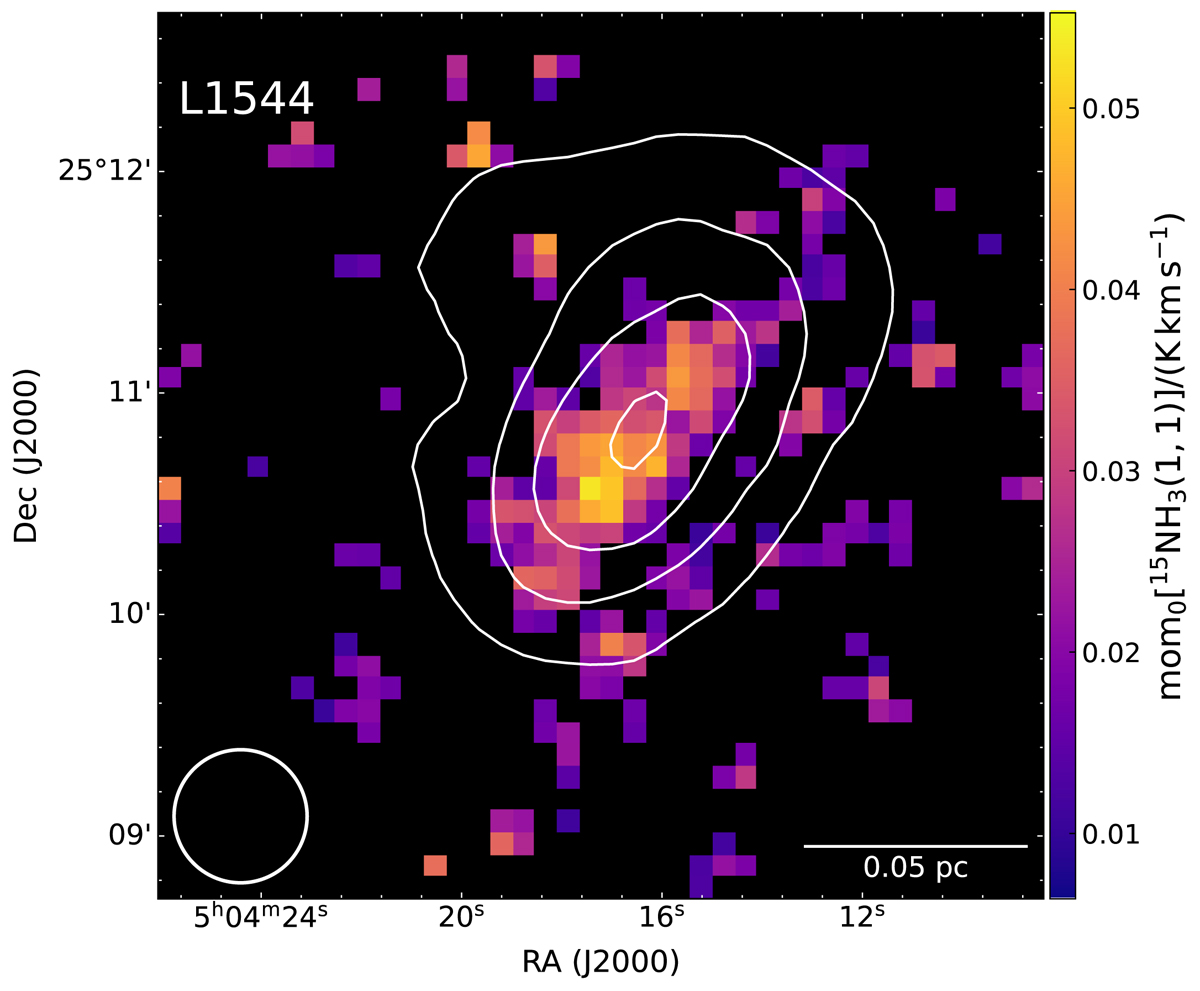
Integrated intensity of 15NH3 (1,1) in L1544, masked following S/N < 3. The contours show the integrated intensity of the NH3 (1,1) line. The levels start at 2 K km s−1 and increase with a step of 3 K km s−1. The average noise level of the map is 6 K km s−1. The beam size and scale bar are shown in the bottom left and right corners, respectively.
Current usage metrics show cumulative count of Article Views (full-text article views including HTML views, PDF and ePub downloads, according to the available data) and Abstracts Views on Vision4Press platform.
Data correspond to usage on the plateform after 2015. The current usage metrics is available 48-96 hours after online publication and is updated daily on week days.
Initial download of the metrics may take a while.