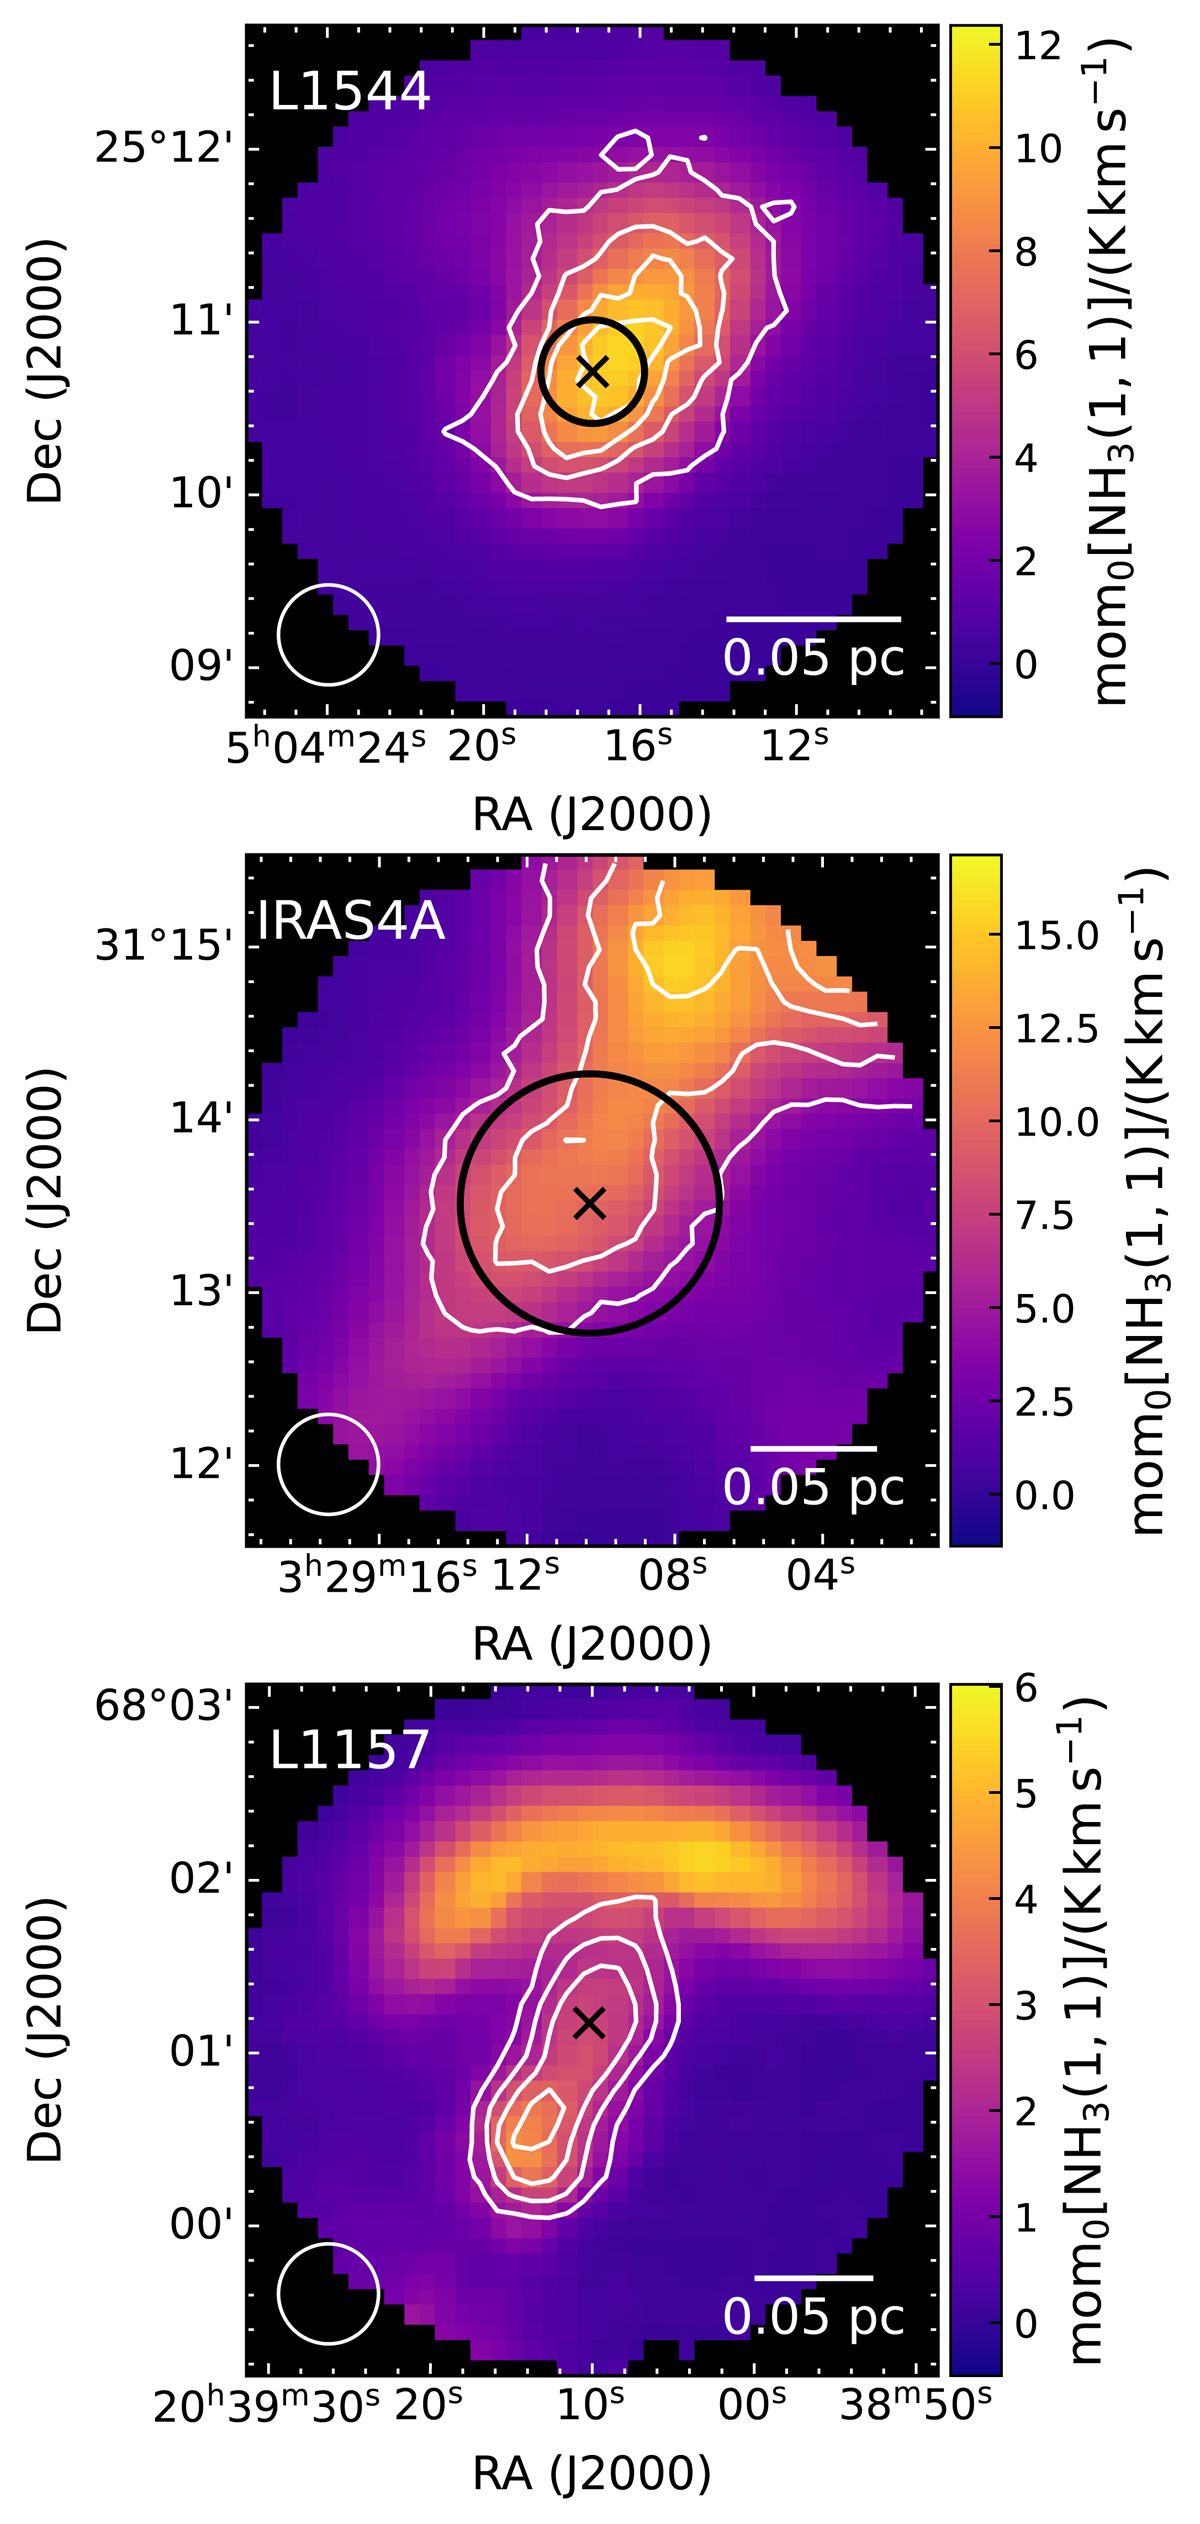
Fig. A.1.
Download original image
Each panel shows the integrated intensity of the NH3 (1,1) line (see colour scale at right). The central pointings (see main text) are shown with a black cross. The contours show the integrated intensity of the corresponding (2,2) transition, at levels of 0.3, 0.5, 0.7, 0.9 of the peak value, which is 0.4 K km s−1 (L1544, top panel), 1.6 K km s−1 (IRAS4A, central panel), and 2.3 K km s−1 (L1157-B1, bottom panel). The beam size and scale bar are shown in the bottom left and right corners, respectively, of each panel. The black circles in the top and central panels show the areas where the spectra in Fig. 1 are extracted.
Current usage metrics show cumulative count of Article Views (full-text article views including HTML views, PDF and ePub downloads, according to the available data) and Abstracts Views on Vision4Press platform.
Data correspond to usage on the plateform after 2015. The current usage metrics is available 48-96 hours after online publication and is updated daily on week days.
Initial download of the metrics may take a while.