Fig. 2.
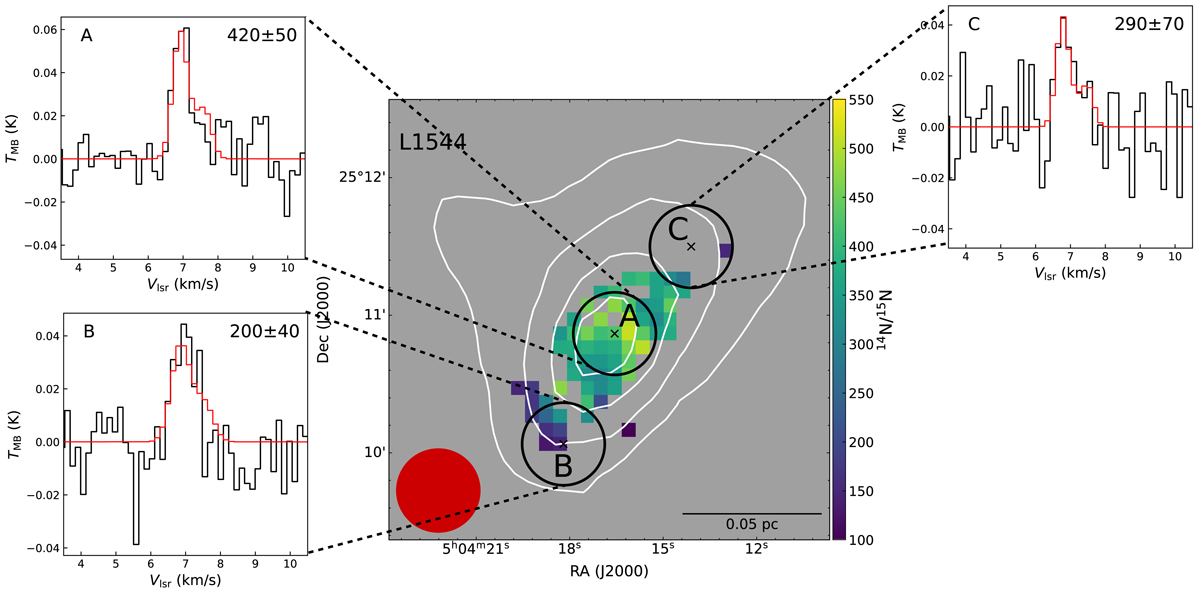
Download original image
Results of the analysis of the ammonia maps in L1544. Central panel: ammonia 14N/15N map. The contours show the total gas density at levels N(H2) = [1,1.5,2,2.5] × 1022 cm−2, obtained from Herschel SED fitting (Spezzano et al. 2017). The black circles show the three offsets (labelled with capital letters) where we compute average spectra to improve the S/N. The averaged 15NH3 (1,1) lines are shown in the surrounding panels (black: observations, red: best-fit models, obtained as described in Appendix B). These panels are labelled in their top left corner, whilst in the top right corners we indicate the measured 14N/15N.
Current usage metrics show cumulative count of Article Views (full-text article views including HTML views, PDF and ePub downloads, according to the available data) and Abstracts Views on Vision4Press platform.
Data correspond to usage on the plateform after 2015. The current usage metrics is available 48-96 hours after online publication and is updated daily on week days.
Initial download of the metrics may take a while.