Fig. 1.
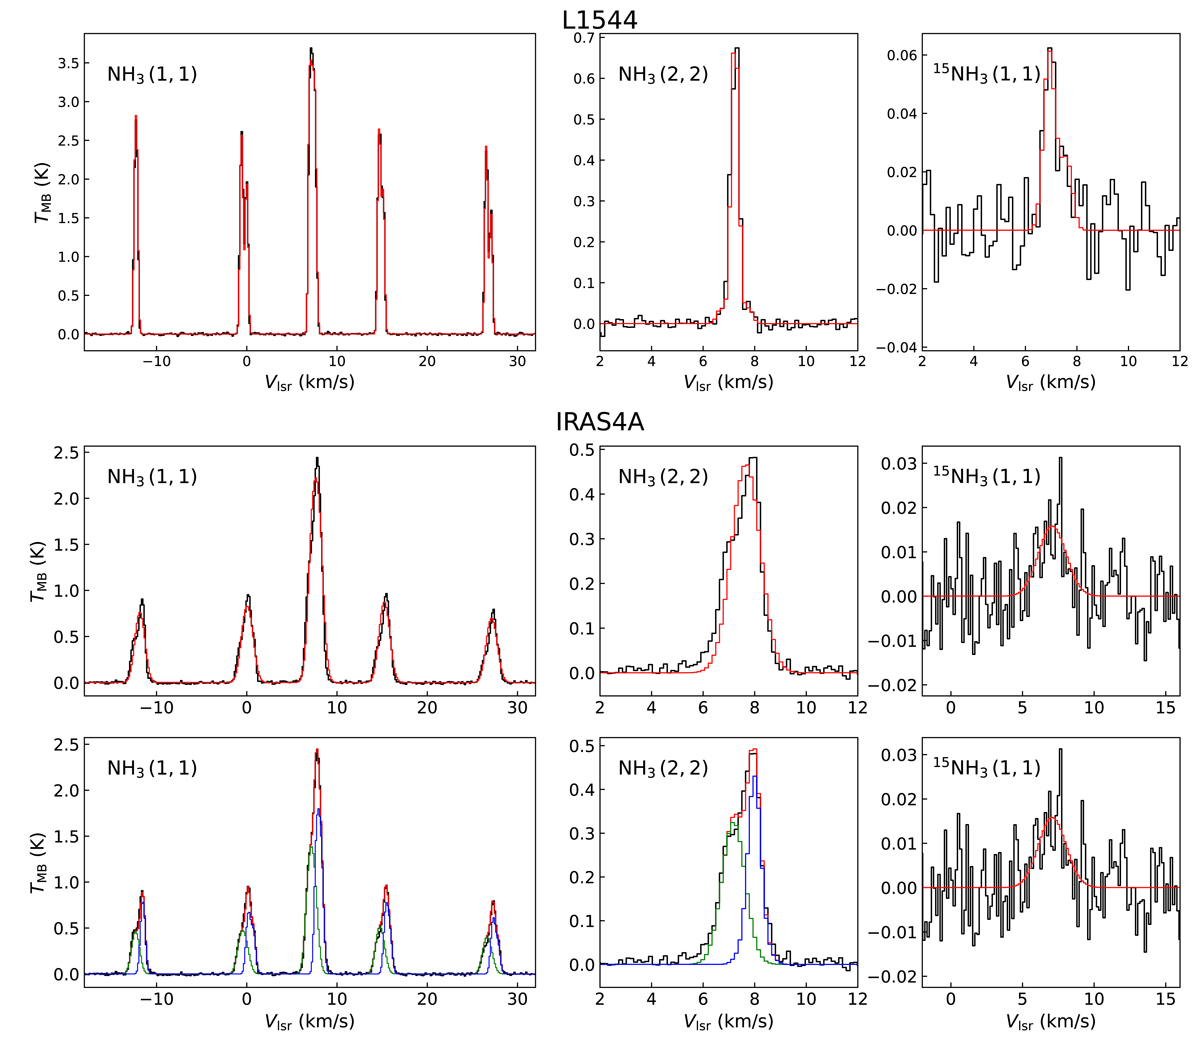
Download original image
Detected ammonia inversion transitions in the central beams (black histograms). Shown from left to right are NH3 (1,1), NH3 (2,2) (central main hyperfine group only), and 15NH3 (1,1). In each panel the coloured histograms show the best-fit results. Top row: spectra extracted in central beam at dust peak of L1544. Centre row: same as the top row, but for IRAS4A. The spectra are averages over the central 90″. The best-fit models obtained using a single velocity-component approach are shown with red histograms. Bottom row: left and central panels show the results of the two-component fit performed on the NH3 lines in IRAS4A. The two velocity-components are shown in green (warmer component) and blue (colder component), whilst the total spectrum is shown in red. In the right panel the red curve shows the one-component fit to the 15NH3 line, using the warmer component fit results as input for the temperature values.
Current usage metrics show cumulative count of Article Views (full-text article views including HTML views, PDF and ePub downloads, according to the available data) and Abstracts Views on Vision4Press platform.
Data correspond to usage on the plateform after 2015. The current usage metrics is available 48-96 hours after online publication and is updated daily on week days.
Initial download of the metrics may take a while.