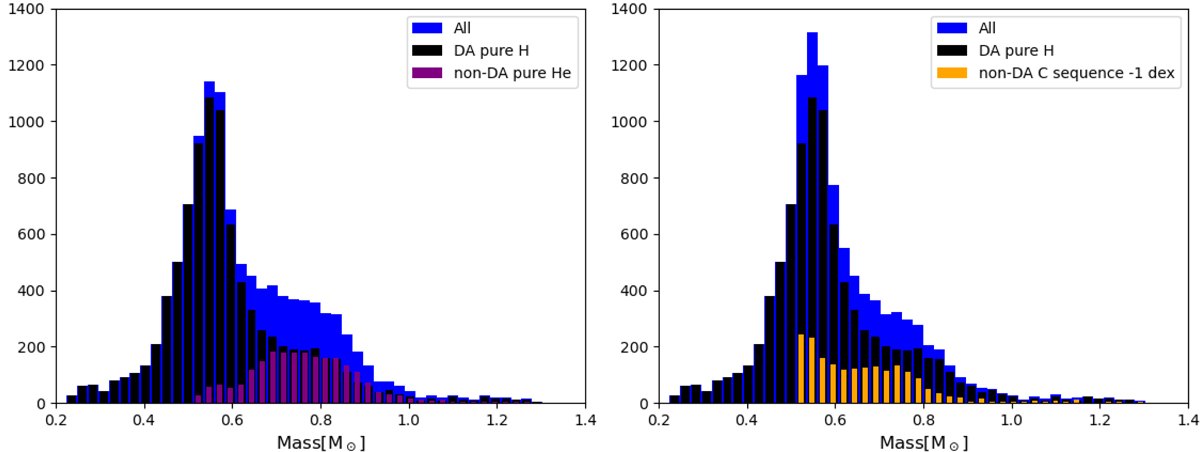
Fig. 8.
Download original image
Mass distributions of the 100 pc white dwarf population spectrally classified into DA and nonDA by Jiménez-Esteban et al. (2023). Left panel: we employed a pure H atmosphere model for all DA white dwarfs and a pure He atmosphere model for all nonDA white dwarfs. The black, purple and blue histograms are the mass distributions of DA, nonDA, and all white dwarfs, respectively. Right panel: same as left panel, but considering a C enrichment following the C sequence −1 dex for all nonDA white dwarfs. The orange histogram shows the mass distribution of these nonDA white dwarfs.
Current usage metrics show cumulative count of Article Views (full-text article views including HTML views, PDF and ePub downloads, according to the available data) and Abstracts Views on Vision4Press platform.
Data correspond to usage on the plateform after 2015. The current usage metrics is available 48-96 hours after online publication and is updated daily on week days.
Initial download of the metrics may take a while.