Fig. 28
Download original image
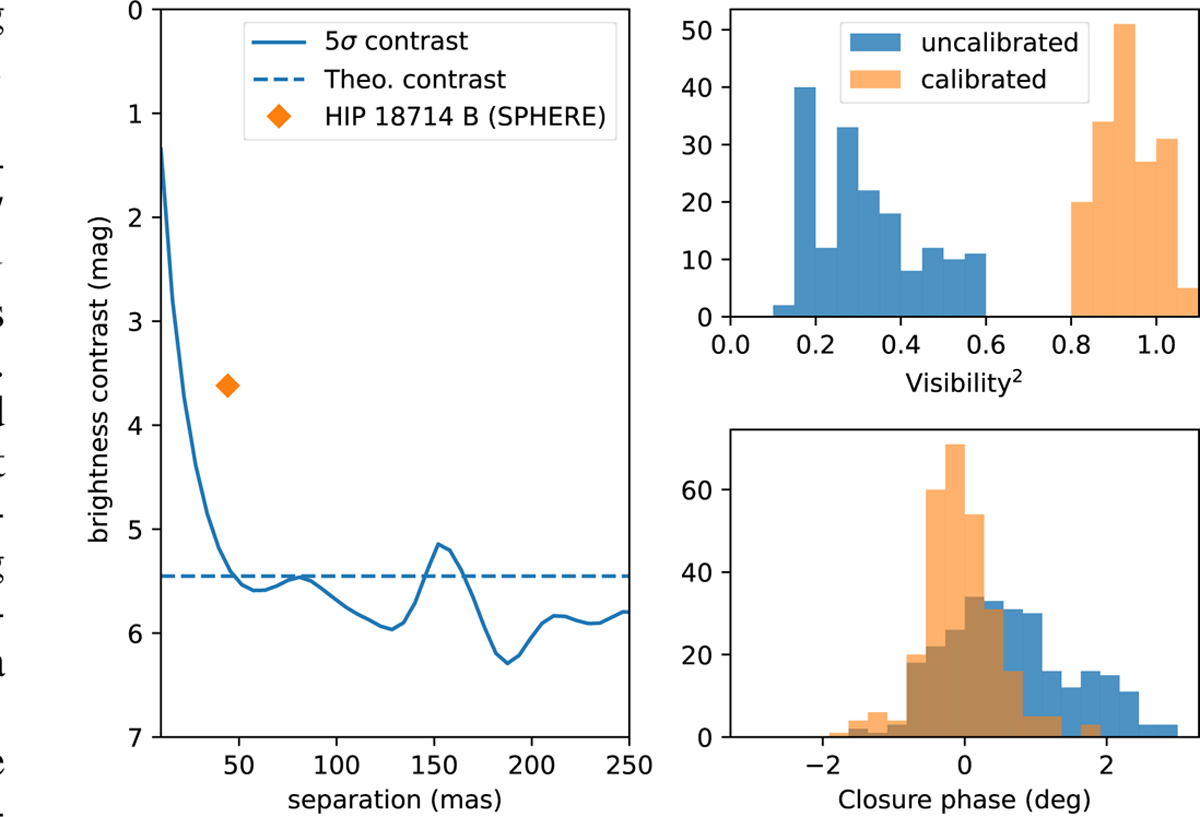
On-sky performance of the SAM-7 mask. Left: the 5σ contrast curve (solid line) observed on HIP 18714 with the mask and the Ks filter. The diamond shows the companion detected by SPHERE in the J band (Bonavita et al. 2022), but not detected by us. The dashed line corresponds to the 5σ theoretical dynamic range assuming an accuracy of 0.5 degrees for the closure phase (according to Eq. (2) in Lacour et al. 2011). Right: histograms of the visibility squared and closure phase per exposure. The standard deviation of the visibity and phase after calibration are respectively 0.06 and 0.52 degrees.
Current usage metrics show cumulative count of Article Views (full-text article views including HTML views, PDF and ePub downloads, according to the available data) and Abstracts Views on Vision4Press platform.
Data correspond to usage on the plateform after 2015. The current usage metrics is available 48-96 hours after online publication and is updated daily on week days.
Initial download of the metrics may take a while.