Fig. 27
Download original image
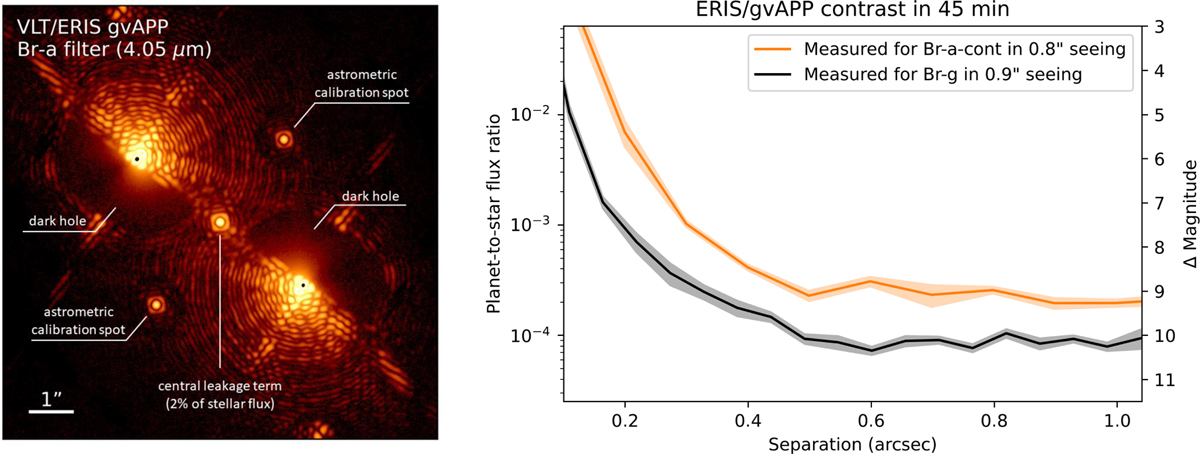
On-sky performance of the gvAPP in NIX. Left: image of the PSF obtained with the mask through the Br-a filter, which matches the theoretical PSF shown in Fig. 17. The image is drawn on a logarithmic scale, and the key elements are labelled. Right: contrast curves for the narrow Br-a-cont and Br-g filters in the L band and Κ band, respectively. The Br-a-cont contrast curve is retrieved using a fake planet injection and recovery test on 45 min of ADI/PCA processed data of HR 8799. The same procedure is applied to a 45 min Br-g dataset of γ Gru. The shaded areas trace the median absolute deviation of the contrast dependent on the parallactic angle of the injected fake planet. The achievable contrast depends on many factors including star magnitude, filter bandwidth and wavelength, seeing, integration time, and data processing method.
Current usage metrics show cumulative count of Article Views (full-text article views including HTML views, PDF and ePub downloads, according to the available data) and Abstracts Views on Vision4Press platform.
Data correspond to usage on the plateform after 2015. The current usage metrics is available 48-96 hours after online publication and is updated daily on week days.
Initial download of the metrics may take a while.