Fig. 21
Download original image
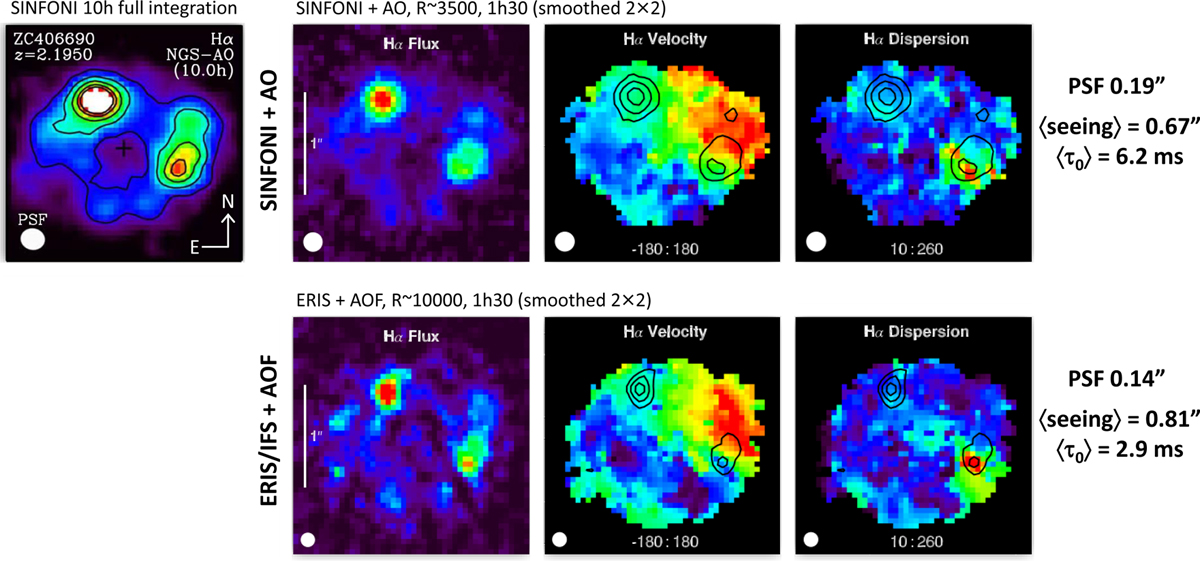
Flux and kinematics maps of the z = 2.19 galaxy ZC406690, comparing LGS-AO integral field spectroscopy between SINFONI (top) and ERIS (bottom). In both cases the data have been lightly smoothed. Far left: full 10 hr archival SINFONI flux map. Top: 90-min sub-set of those data (showing flux, velocity, and dispersion), taken in reasonably good conditions. Bottom: 90-min ERIS dataset taken at R ~ 10 000 in less optimal conditions. ERIS data were taken early in commissioning before the AO system was optimised, but already outperform the equivalent R ~ 3500 SINFONI dataset, and show all the structure visible in the full SINFONI integration.
Current usage metrics show cumulative count of Article Views (full-text article views including HTML views, PDF and ePub downloads, according to the available data) and Abstracts Views on Vision4Press platform.
Data correspond to usage on the plateform after 2015. The current usage metrics is available 48-96 hours after online publication and is updated daily on week days.
Initial download of the metrics may take a while.