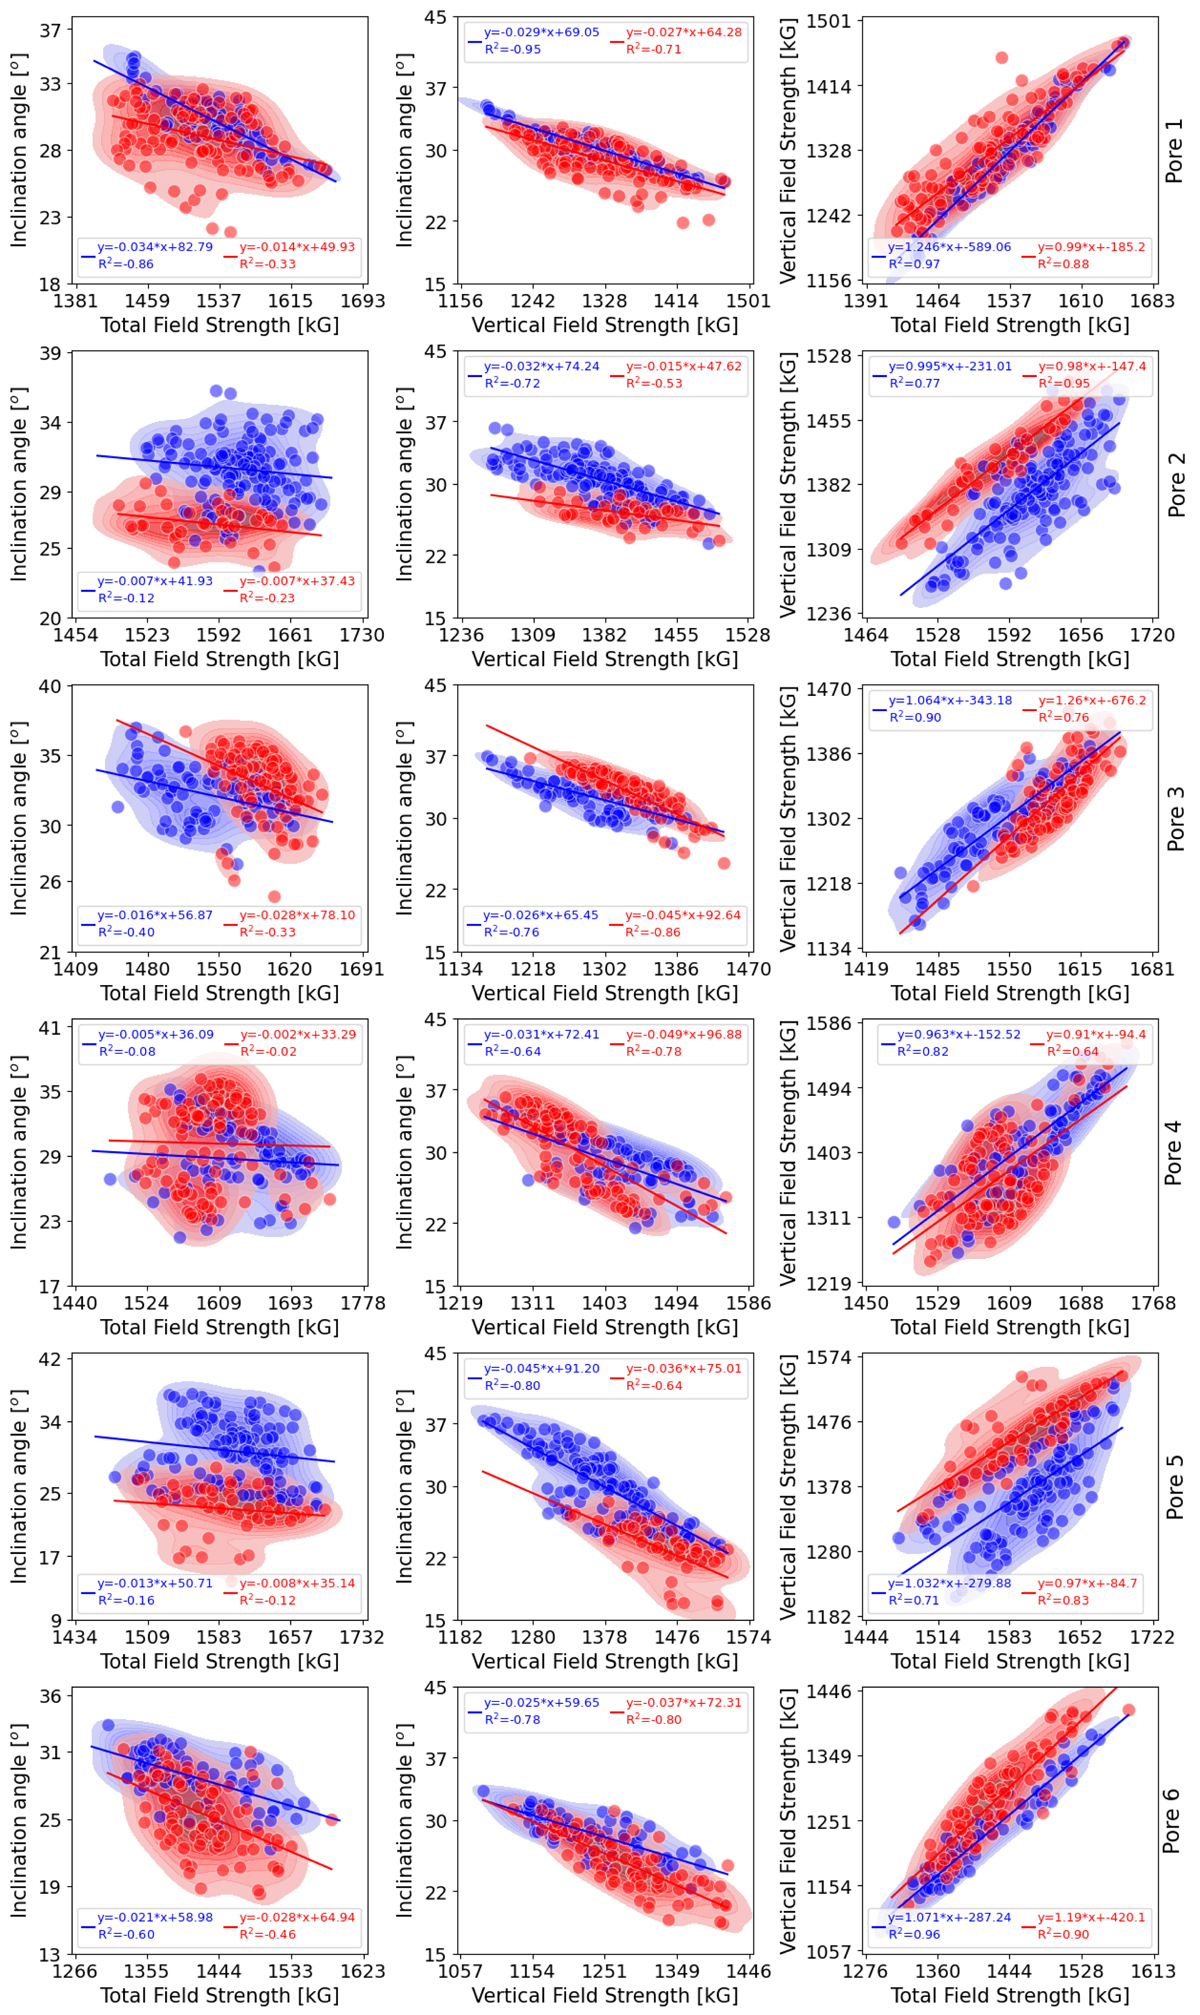
Fig. 6.
Download original image
Scatter plot displaying the correlation between magnetic parameters derived from the boundary of the studied pores. The red colour represents the correlation between parameters during the time period before the maximum vertical magnetic field is reached (see Fig. 5), while the blue colour represents the correlation for the time period after that instant. The shaded background contours depict the kernel density estimate plot of the correlation distribution. The insets give the parameters of the linear fit and the Pearson correlation coefficient separately for the two phases.
Current usage metrics show cumulative count of Article Views (full-text article views including HTML views, PDF and ePub downloads, according to the available data) and Abstracts Views on Vision4Press platform.
Data correspond to usage on the plateform after 2015. The current usage metrics is available 48-96 hours after online publication and is updated daily on week days.
Initial download of the metrics may take a while.