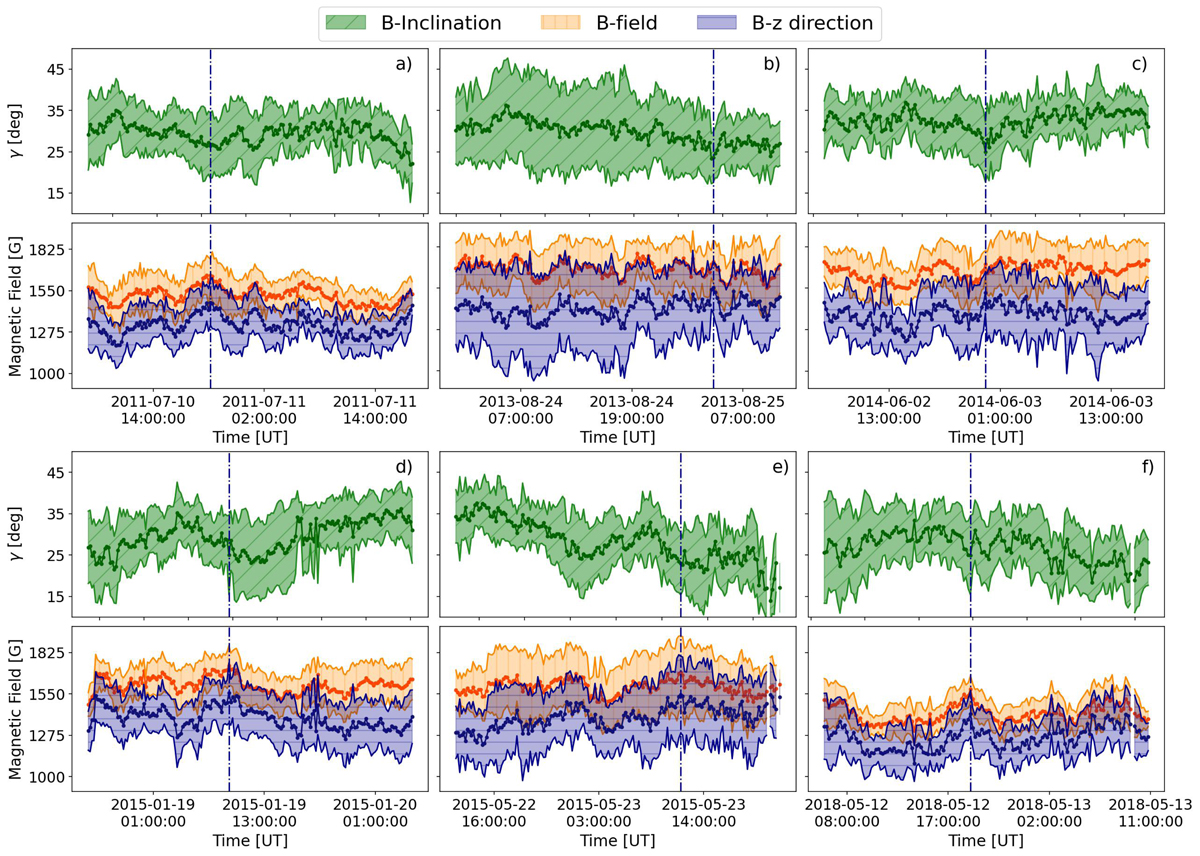
Fig. 5.
Download original image
Time evolution of the magnetic parameters obtained from the pore’s boundary contours. The main, thicker line in each plot represents the mean value obtained from the contours over each respective magnetic parameter, whereas the corresponding shaded areas refer to the standard deviation also calculated from the contours. Figure displays the magnetic field inclination angle (green pattern), the total magnetic field strength (orange pattern), and the vertical magnetic field (blue pattern) for the six pores under study. The vertical dotted line in each panel denotes the time instant when the vertical magnetic field average over the boundary contour reached its maximum value.
Current usage metrics show cumulative count of Article Views (full-text article views including HTML views, PDF and ePub downloads, according to the available data) and Abstracts Views on Vision4Press platform.
Data correspond to usage on the plateform after 2015. The current usage metrics is available 48-96 hours after online publication and is updated daily on week days.
Initial download of the metrics may take a while.