Open Access
Fig. 2.
Download original image
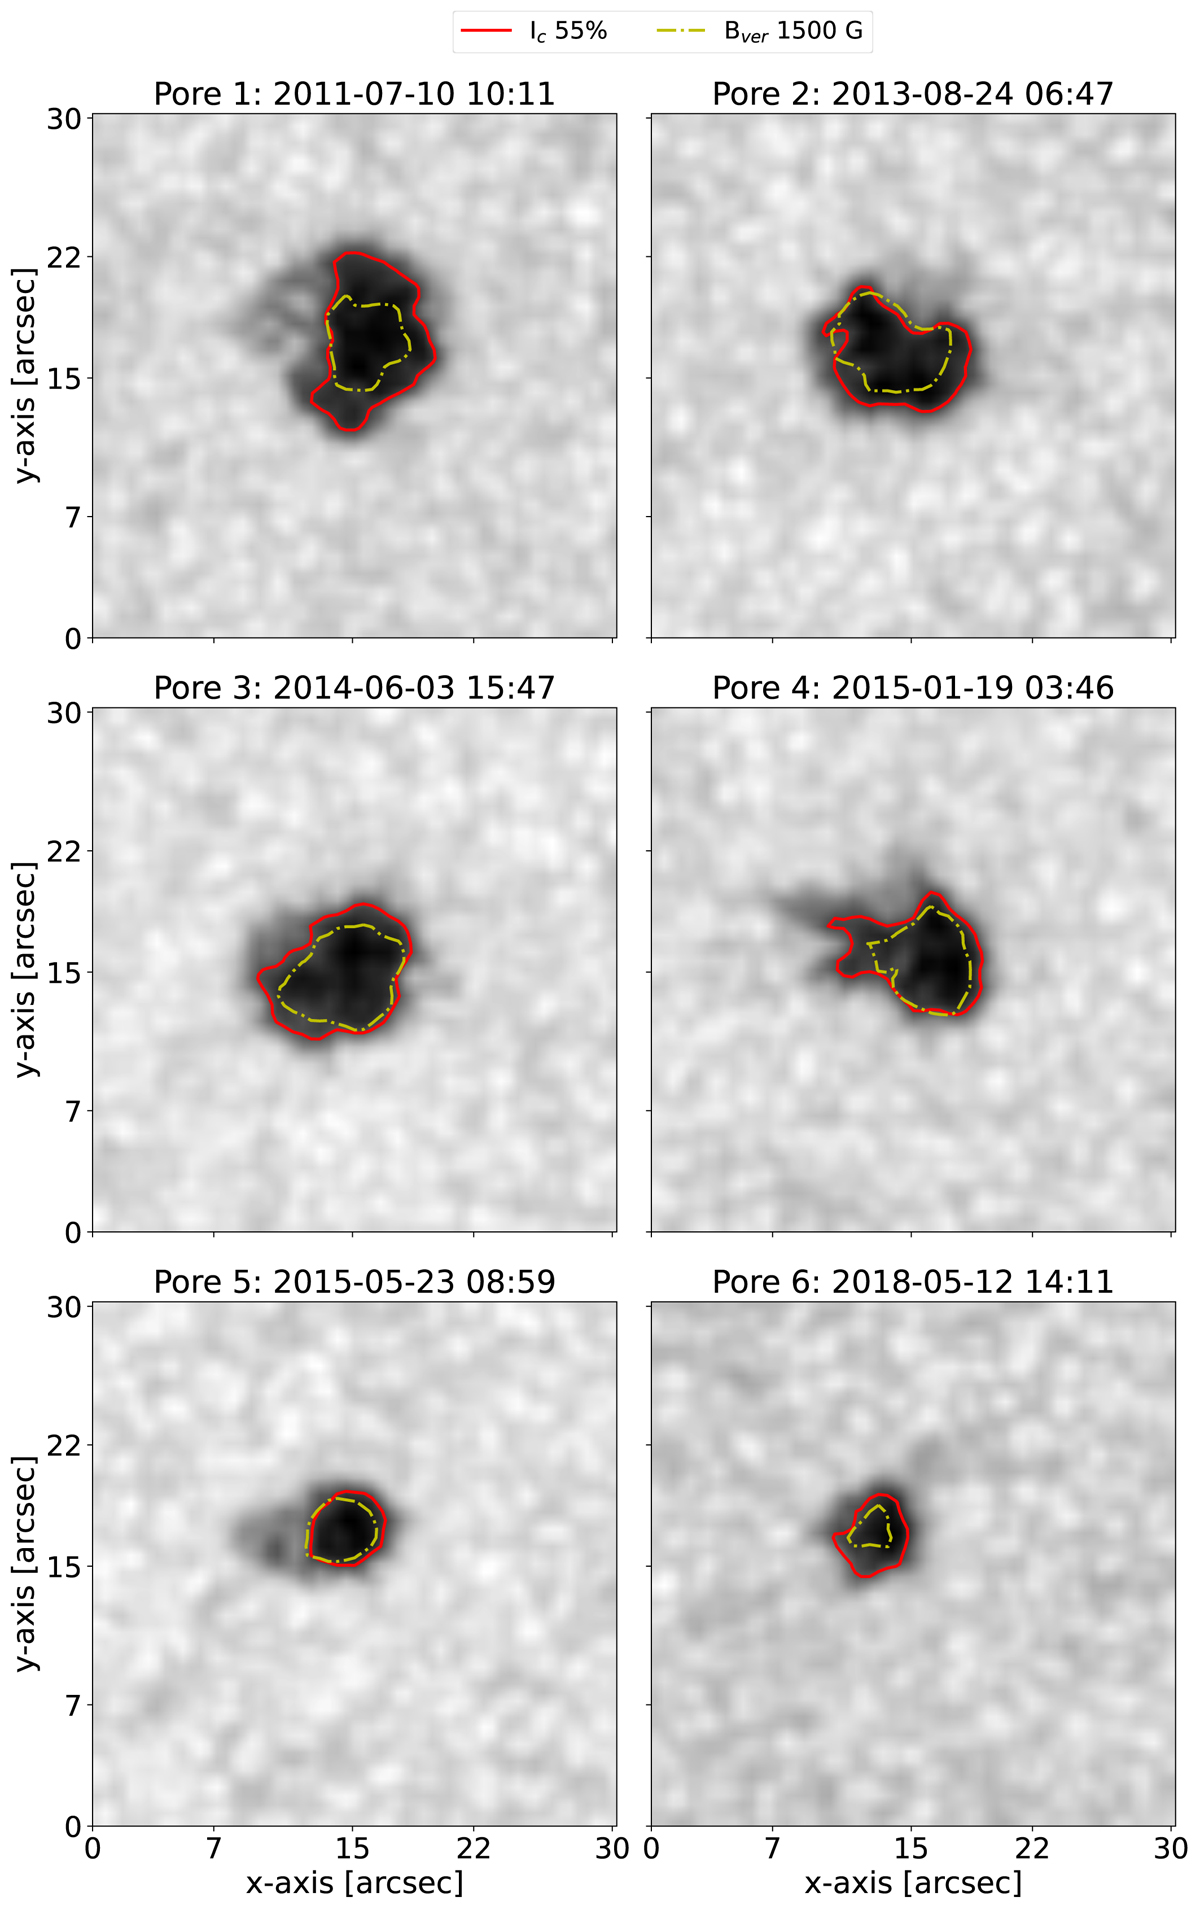
HMI continuum maps of the six different solar pores studied that evolved with values of μ greater than 0.9. The red contours outline an intensity value of 55% Ic, and the yellow contours outline the level of the maximum vertical magnetic field Bver found in the present work.
Current usage metrics show cumulative count of Article Views (full-text article views including HTML views, PDF and ePub downloads, according to the available data) and Abstracts Views on Vision4Press platform.
Data correspond to usage on the plateform after 2015. The current usage metrics is available 48-96 hours after online publication and is updated daily on week days.
Initial download of the metrics may take a while.