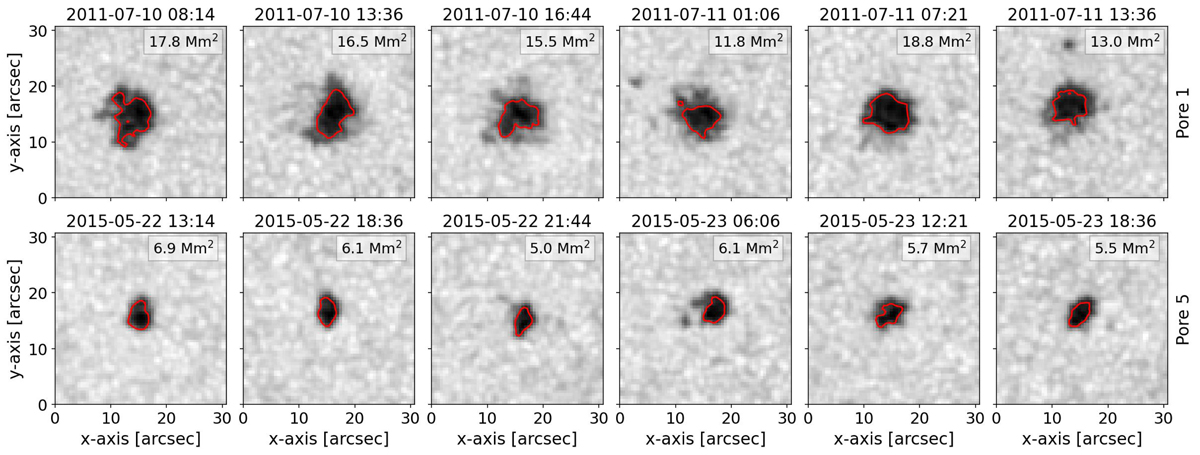
Fig. 1.
Download original image
Time evolution of two of the studied pores with the 55% intensity contours overplotted (red solid line). From left to right, snapshots during the pore’s lifetime. The first row shows the evolution of pore 1, which revealed strong changes of the area. The second row shows pore 5, which revealed a quasi-stable area evolution. The accompanying movie shows the evolution of each of the six pores under study.
Current usage metrics show cumulative count of Article Views (full-text article views including HTML views, PDF and ePub downloads, according to the available data) and Abstracts Views on Vision4Press platform.
Data correspond to usage on the plateform after 2015. The current usage metrics is available 48-96 hours after online publication and is updated daily on week days.
Initial download of the metrics may take a while.