Fig. 9.
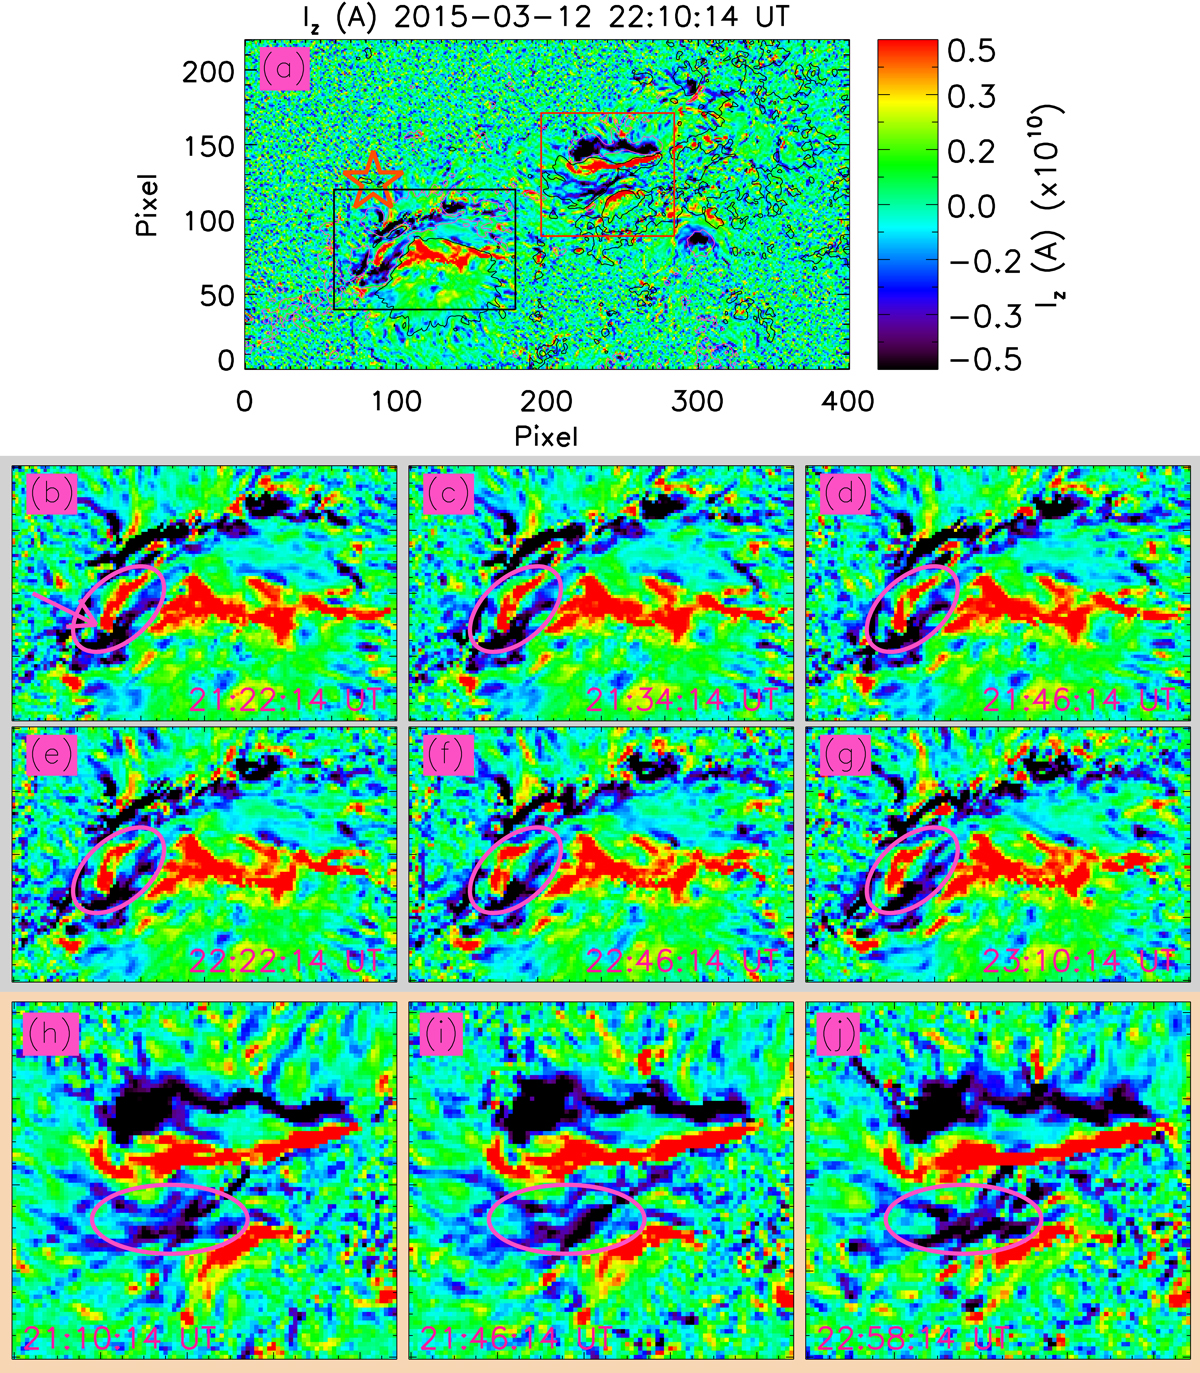
Download original image
Morphology and evolution of photospheric vertical current (Iz). Panel a: photospheric vertical current (Iz) map of the active region NOAA 12297. Contours of the z-component of a co-temporal vector magnetogram are plotted in panel a. The contour levels are ±300 G with the black and pink contours referring to positive and negative polarity magnetic fields, respectively. Two regions characterised by strong currents are enclosed by the black and the red boxes. The orange-coloured five-pointed star indicates the LCO. Panels b–g: representative Iz-maps of the regions enclosed by the black box showing the evolution of Iz during the interval of our analysis. The pink arrow in panel b indicates a location characterised by extreme close proximity of opposite polarity currents. The oval shapes in panels b–g enclose a positive Iz region which undergoes decay prior to the onset of the flare but grows following the event. Panels h–j: brief evolution of Iz-maps of the region encircled by the red box in panel a. The pink oval in these panels encircle a negative current region which undergoes significant changes during the interval of our analysis.
Current usage metrics show cumulative count of Article Views (full-text article views including HTML views, PDF and ePub downloads, according to the available data) and Abstracts Views on Vision4Press platform.
Data correspond to usage on the plateform after 2015. The current usage metrics is available 48-96 hours after online publication and is updated daily on week days.
Initial download of the metrics may take a while.