Fig. 8.
Download original image
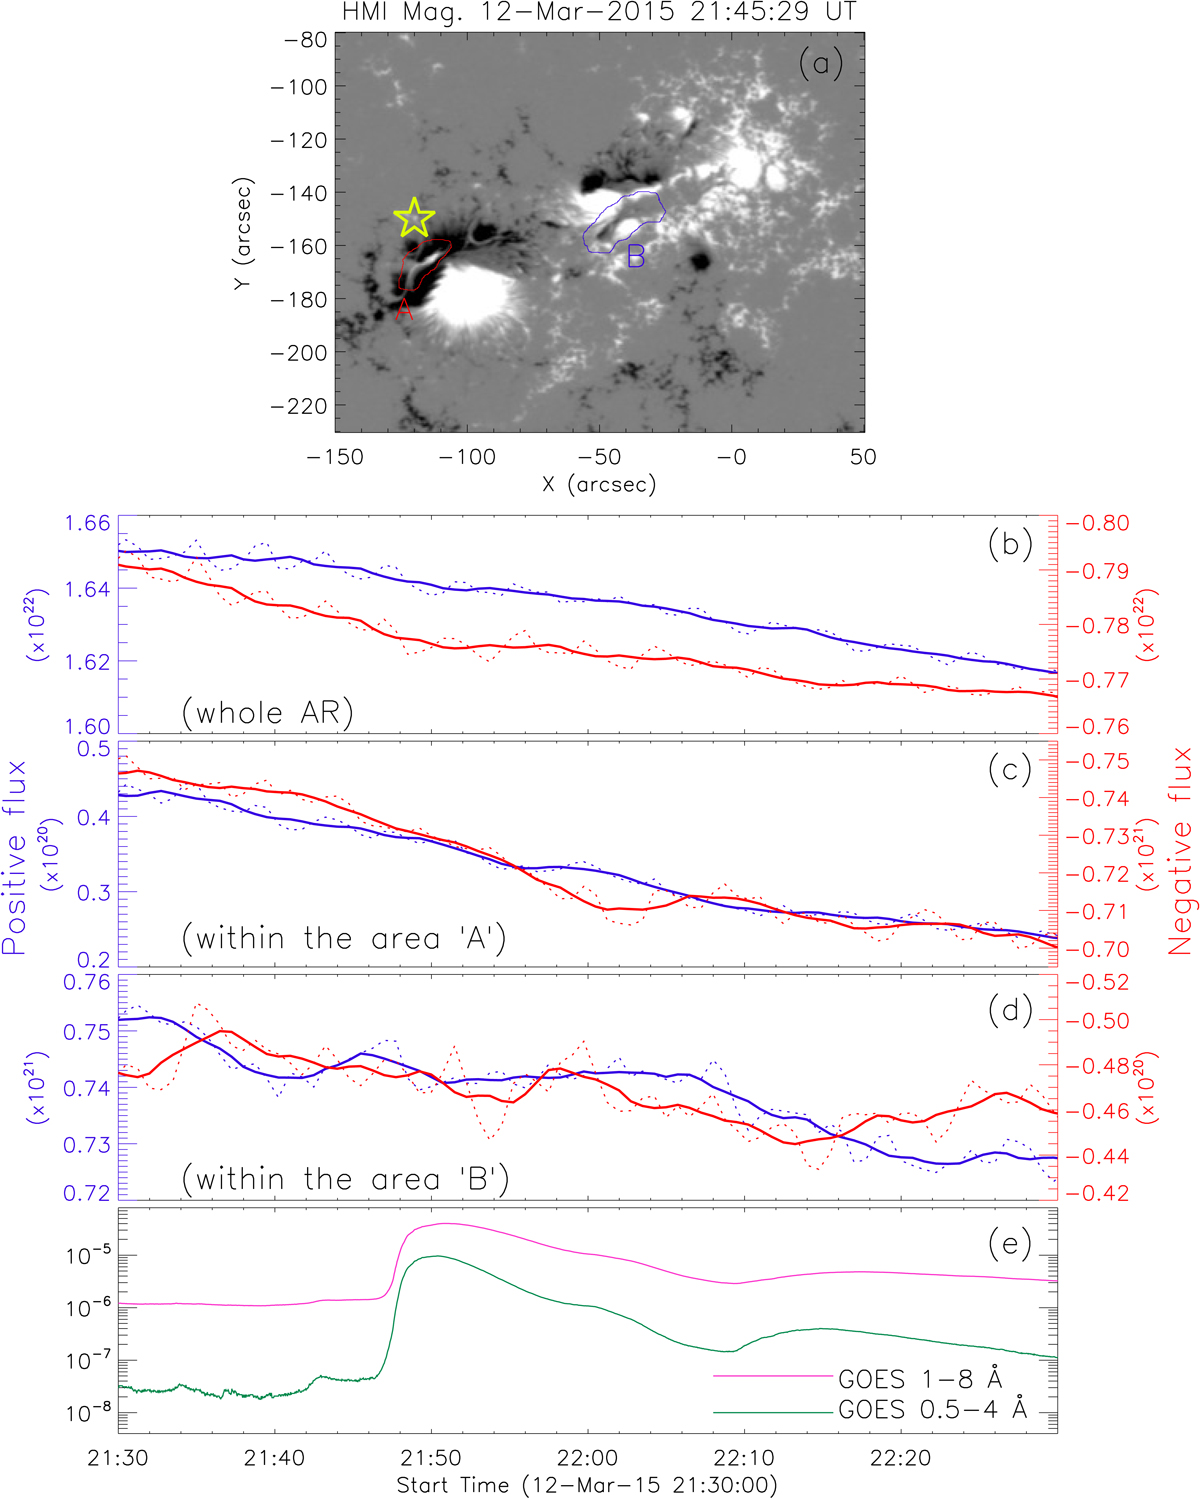
Morphology and evolution of photospheric magnetic field of the active region NOAA 12297. Panel a: HMI LOS magnetogram of active region NOAA 12297 prior to the onset of the M2.7 flare. Two regions are specified in the active region, which are enclosed by the curves marked by ‘A’ and ‘B’. The yellow five-pointed star indicates the LCO. Panels b–d: temporal evolution of magnetic flux within the whole active region and within the regions marked by ‘A’ and ‘B’, respectively. The dotted curved represent the actual values of magnetic fluxes and the solid curves represent the seven-point running averages of the fluxes. Panel e: GOES 1−8 and 0.5−4 Å flux variations.
Current usage metrics show cumulative count of Article Views (full-text article views including HTML views, PDF and ePub downloads, according to the available data) and Abstracts Views on Vision4Press platform.
Data correspond to usage on the plateform after 2015. The current usage metrics is available 48-96 hours after online publication and is updated daily on week days.
Initial download of the metrics may take a while.