Fig. 6.
Download original image
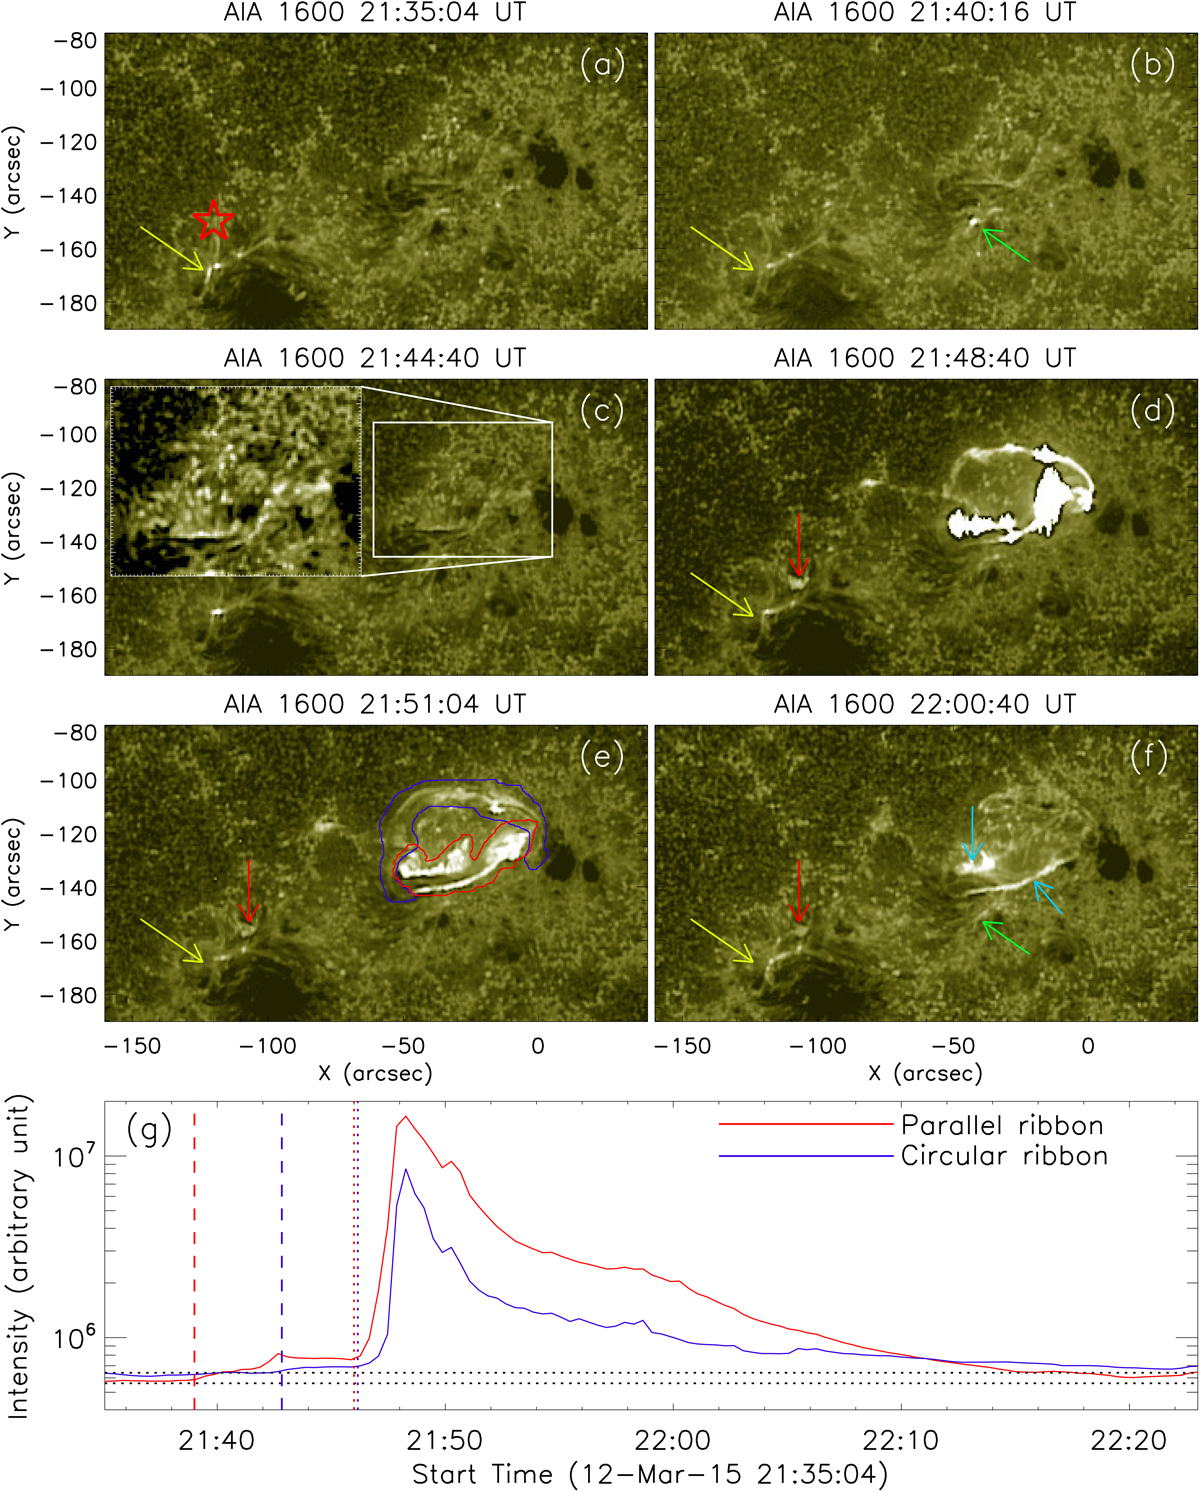
Low-atmospheric brightenings during the GOES M2.7 flare. Panels a–f: series of AIA 1600 Å images of the active region NOAA 12297 showing the pre- and main flaring phases of the M-class event. The yellow arrows indicate a highly localised bright kernel. The red five-pointed star in panel a indicates the LCO. The green arrow in panel b indicates a secondary bright kernel that appeared only a few minutes prior to the onset of the flare. The green arrow in panel f displays the location of the secondary bright kernel in comparison with the parallel ribbons. The blue and red coloured closed curves in panel e enclose the circular and parallel ribbons, respectively. The sky-blue arrows in panel f indicate the parallel ribbon brightening. The red arrows indicate a localised bright kernel co-temporal with the circular ribbon brightening. Panel g: temporal evolution of AIA 1600 Å intensity from the circular (blue curve) and parallel (red curve) ribbon areas. The horizontal dotted lines indicate the pre-flare values. The dashed vertical lines indicate the onset times of mild intensity enhancement a few minutes prior to the flare. The dotted vertical lines indicate the times of the impulsive intensity enhancements from the circular and parallel ribbons.
Current usage metrics show cumulative count of Article Views (full-text article views including HTML views, PDF and ePub downloads, according to the available data) and Abstracts Views on Vision4Press platform.
Data correspond to usage on the plateform after 2015. The current usage metrics is available 48-96 hours after online publication and is updated daily on week days.
Initial download of the metrics may take a while.