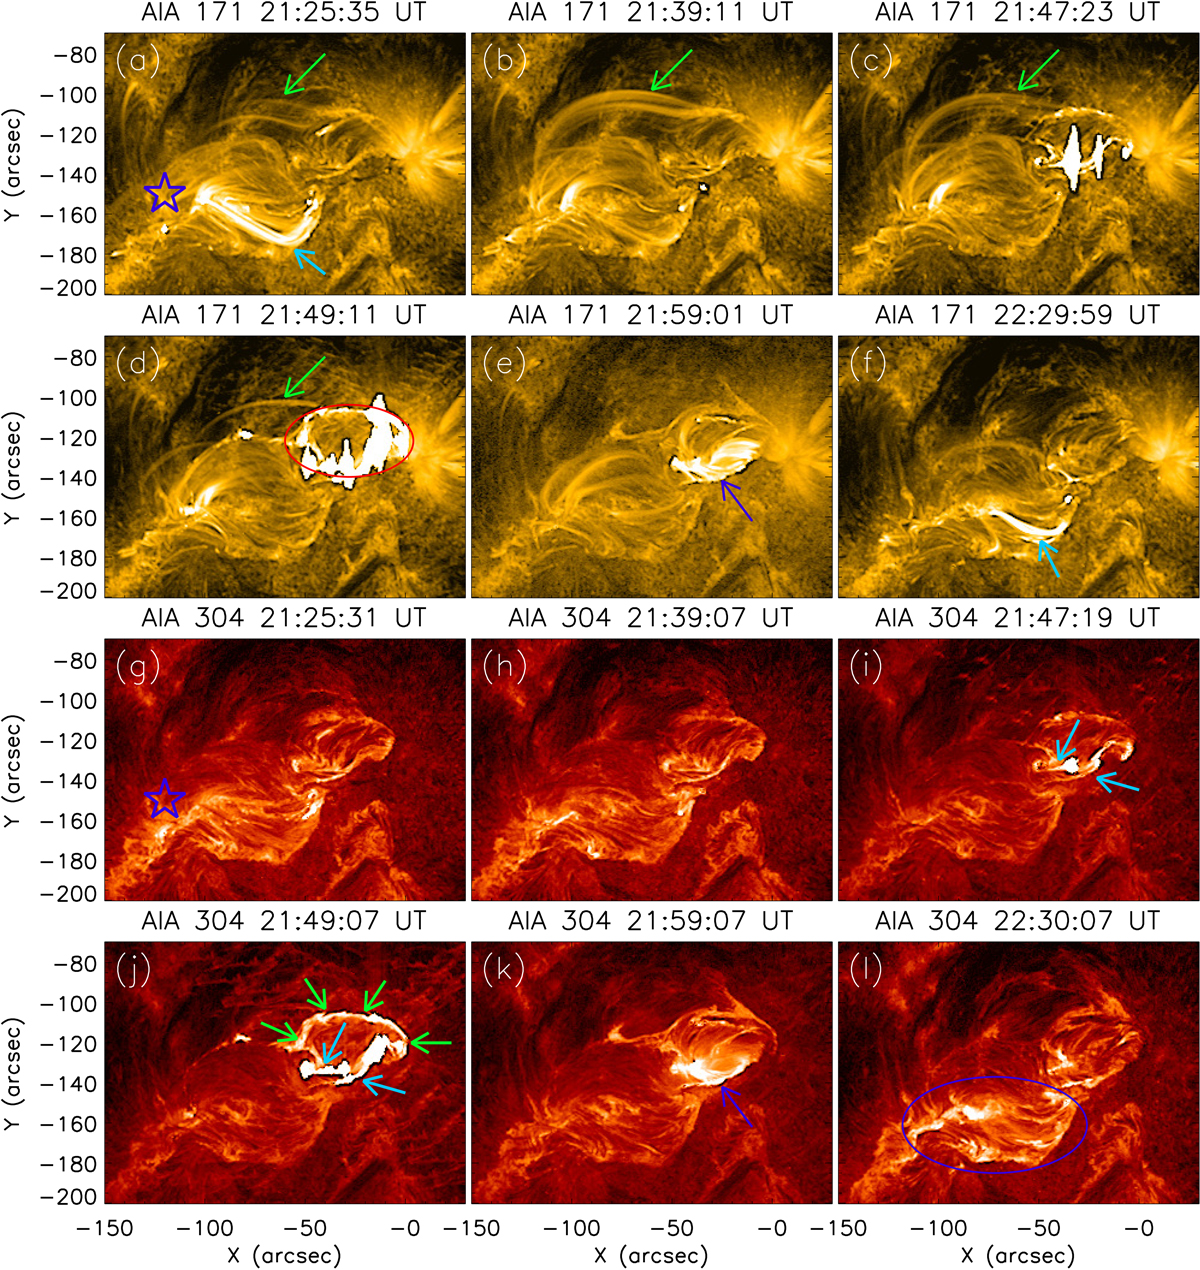
Fig. 5.
Download original image
Series of AIA 171 (panels a–f) and 304 (panels g–l) Å images of the active region NOAA 12297 showing the evolution of the M2.7 flare as well as the extended period following it. The green arrows in panels a–d indicate the rapid restructuring of the spine-like lines during the M-class flare. The sky-coloured arrows in panels a and f indicate a few bright coronal loops associated with the QSL. The red oval in panel d and the green arrows in panel j indicate the circular ribbon brightening during the flare. The sky-blue arrows in panels i and j indicate parallel ribbon brightening. The blue arrows in panels e and k indicate post-reconnection arcade. The blue oval in panel l encloses the brightenings from the location of the QSL. The blue five-pointed stars in panels a and g indicate the LCO.
Current usage metrics show cumulative count of Article Views (full-text article views including HTML views, PDF and ePub downloads, according to the available data) and Abstracts Views on Vision4Press platform.
Data correspond to usage on the plateform after 2015. The current usage metrics is available 48-96 hours after online publication and is updated daily on week days.
Initial download of the metrics may take a while.