Fig. 4.
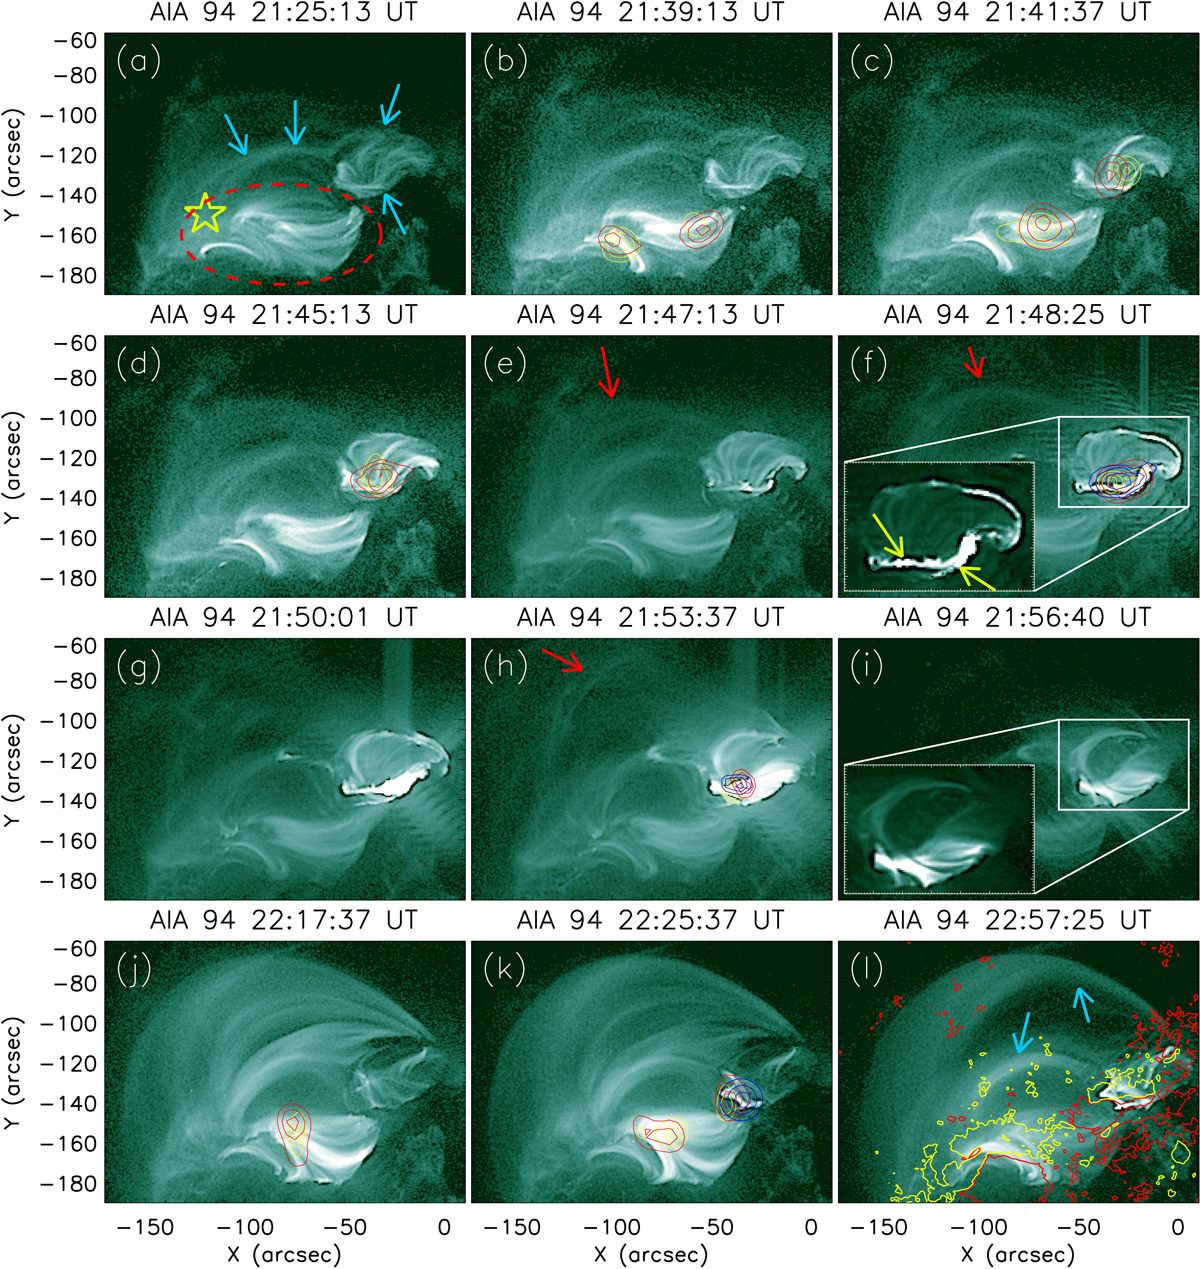
Download original image
Series of AIA 94 Å images of the active region NOAA 12297 showing the evolution of the M2.7 flare as well as the extended period following it. Co-temporal LOS magnetogram contours are overplotted in panel l. Contour levels are ±200 G. Red and yellow contours refer to positive and negative magnetic flux, respectively. PIXON re-constructed co-temporal RHESSI 3−6 keV (yellow), 6−12 keV (red), 12−25 keV (blue) contours are overplotted in panels b–d, f, h, j, and k. Contour levels are [50, 70, 90]% of the corresponding peak flux. The sky-coloured arrows in panel a indicate a fan-spine-like configuration while the red dashed oval outlines the coronal loops associated with the QSL structure. The yellow star indicates the common location (LCO) where both the spine-like coronal lines and the QSL-associated coronal loops terminated on the photosphere. The red arrows in panels e, f, and h indicate an expanding loop system. The yellow arrows in the inset of panel f indicate parallel flare ribbons. The sky-coloured arrows in panel l indicate a few large coronal loops connecting the leading part of the active region to the trailing part. The boxes in panels f and i also indicate the FOV of Fig. 7.
Current usage metrics show cumulative count of Article Views (full-text article views including HTML views, PDF and ePub downloads, according to the available data) and Abstracts Views on Vision4Press platform.
Data correspond to usage on the plateform after 2015. The current usage metrics is available 48-96 hours after online publication and is updated daily on week days.
Initial download of the metrics may take a while.