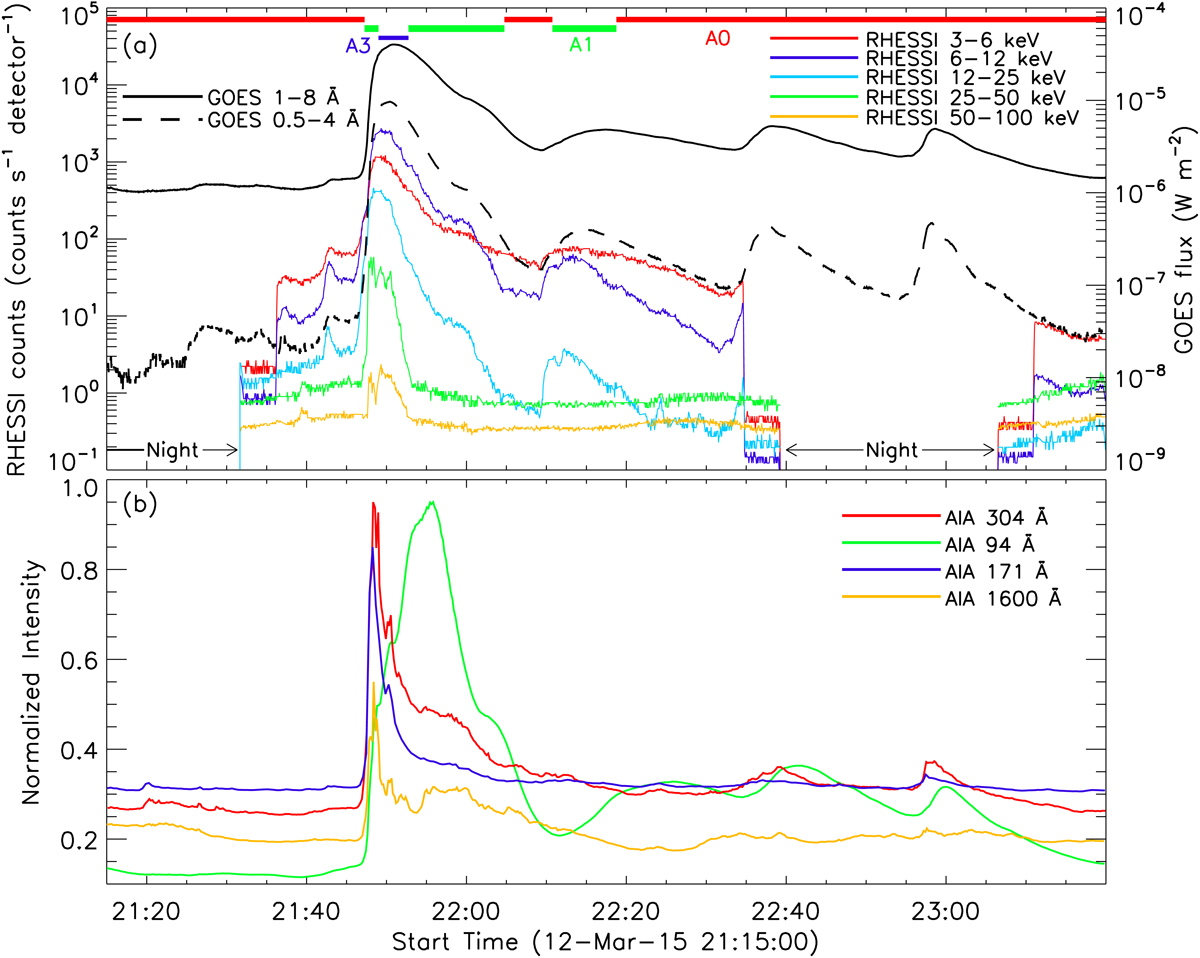
Fig. 3.
Download original image
Temporal evolution of the GOES M2.7 flare. Panel a: temporal evolution of GOES SXR flux and RHESSI counts between 21:15 UT and 23:20 UT on 12 march 2015. The attenuator states of RHESSI are indicated at the top of panel a. Durations of RHESSI nights within the observing period are mentioned at the bottom of panel a. Panel b: (E)UV light curves within the same interval derived from different AIA channels. For clear visualisation, the intensities in the AIA channels are scaled by 95% for the 94 Å and 304 Å channels, 55% for the 171 Å channel and 85% for the 1600 Å channel.
Current usage metrics show cumulative count of Article Views (full-text article views including HTML views, PDF and ePub downloads, according to the available data) and Abstracts Views on Vision4Press platform.
Data correspond to usage on the plateform after 2015. The current usage metrics is available 48-96 hours after online publication and is updated daily on week days.
Initial download of the metrics may take a while.