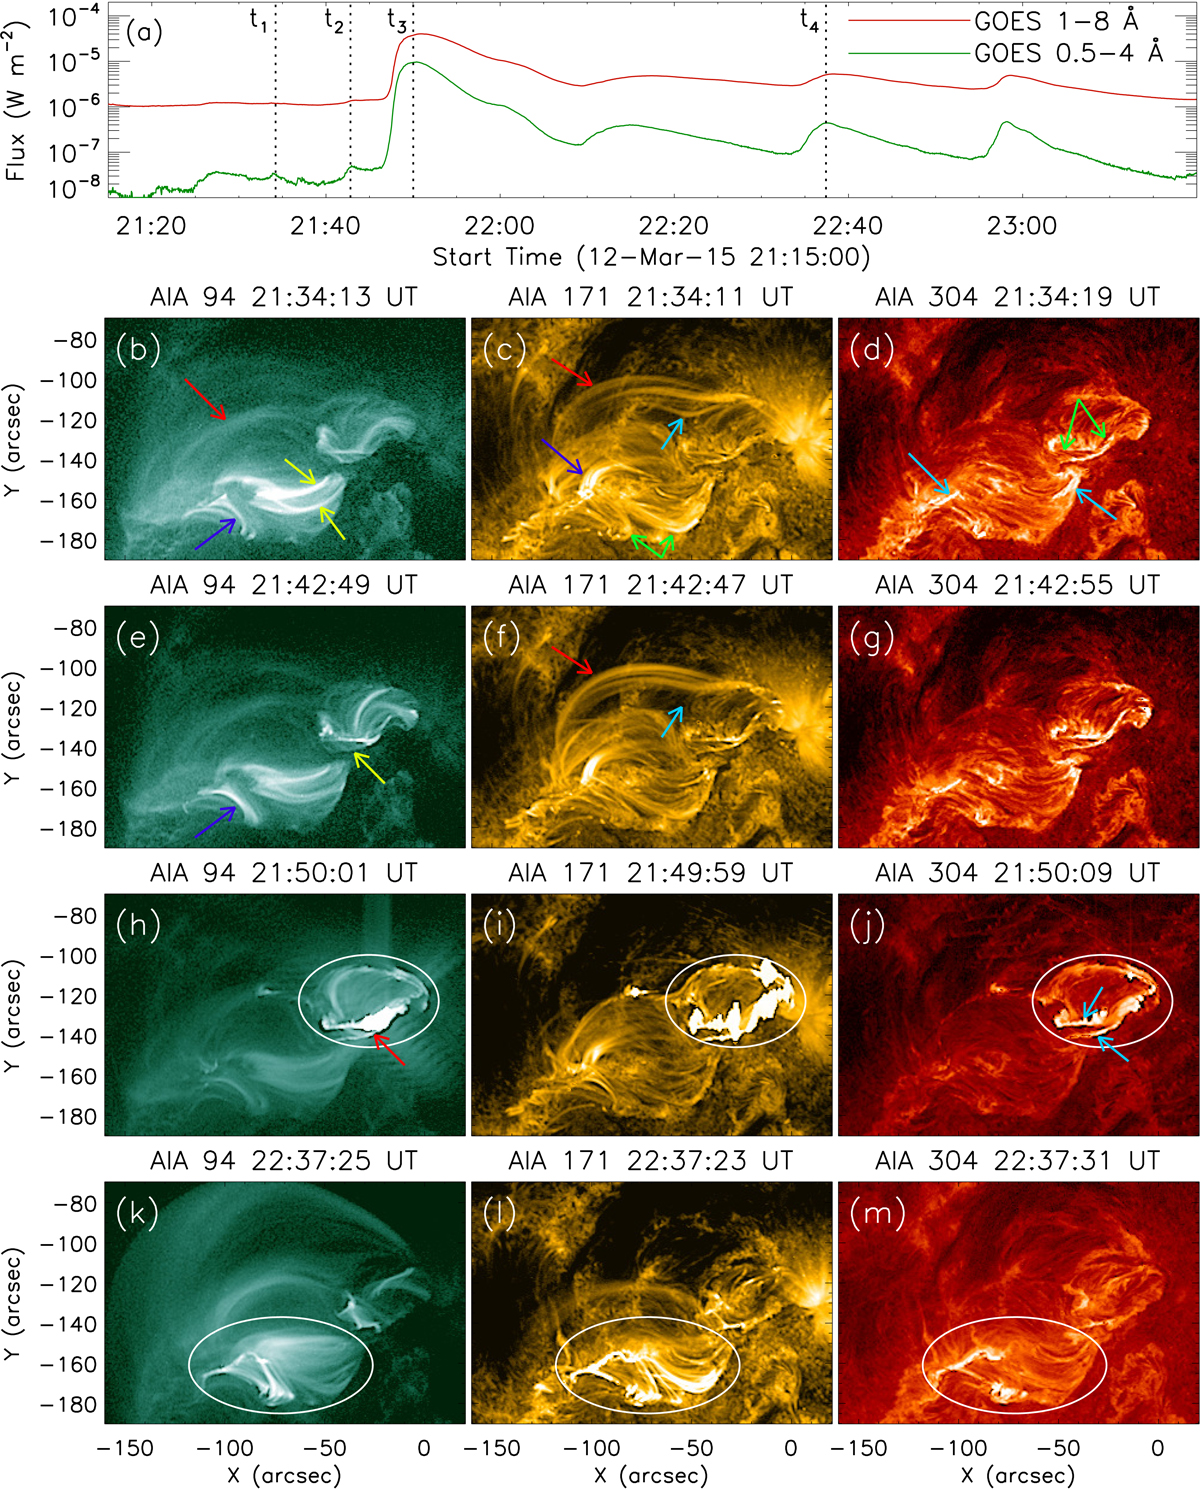
Fig. 2.
Download original image
Multi-wavelength evolution of the M2.7 flare on 12 March 2015. Panel a: soft-X-ray evolution GOES 1−8 Å and 0.5−4 Å channels, showing the initiation and evolution of the flare as well as the extended period following the flare that included multiple small peaks. Panels b–m: EUV images of the active region during the period of our observation in AIA 94 Å (left column), 171 Å (middle column), and 304 Å (right column) channels. The panels in each row are co-temporal. The time information for each row is indicated in panel a by the dotted lines (marked ‘t1’–‘t4’). Different arrows in different panels indicate a few important coronal loop systems and brightenings during the interval of observation. The oval shapes in panels h–j outline the circular flare ribbon, while the oval shapes in panels k–m outline brightening from the apparent QSL structure. A movie associated with this figure is available online. The movie has a duration of 40 s and displays the temporal evolution of the active region in AIA 94, 171, and 304 Å wavelengths with 12 s cadence between 21:15 UT and 23:20 UT on 12 March 2015.
Current usage metrics show cumulative count of Article Views (full-text article views including HTML views, PDF and ePub downloads, according to the available data) and Abstracts Views on Vision4Press platform.
Data correspond to usage on the plateform after 2015. The current usage metrics is available 48-96 hours after online publication and is updated daily on week days.
Initial download of the metrics may take a while.