Fig. 11.
Download original image
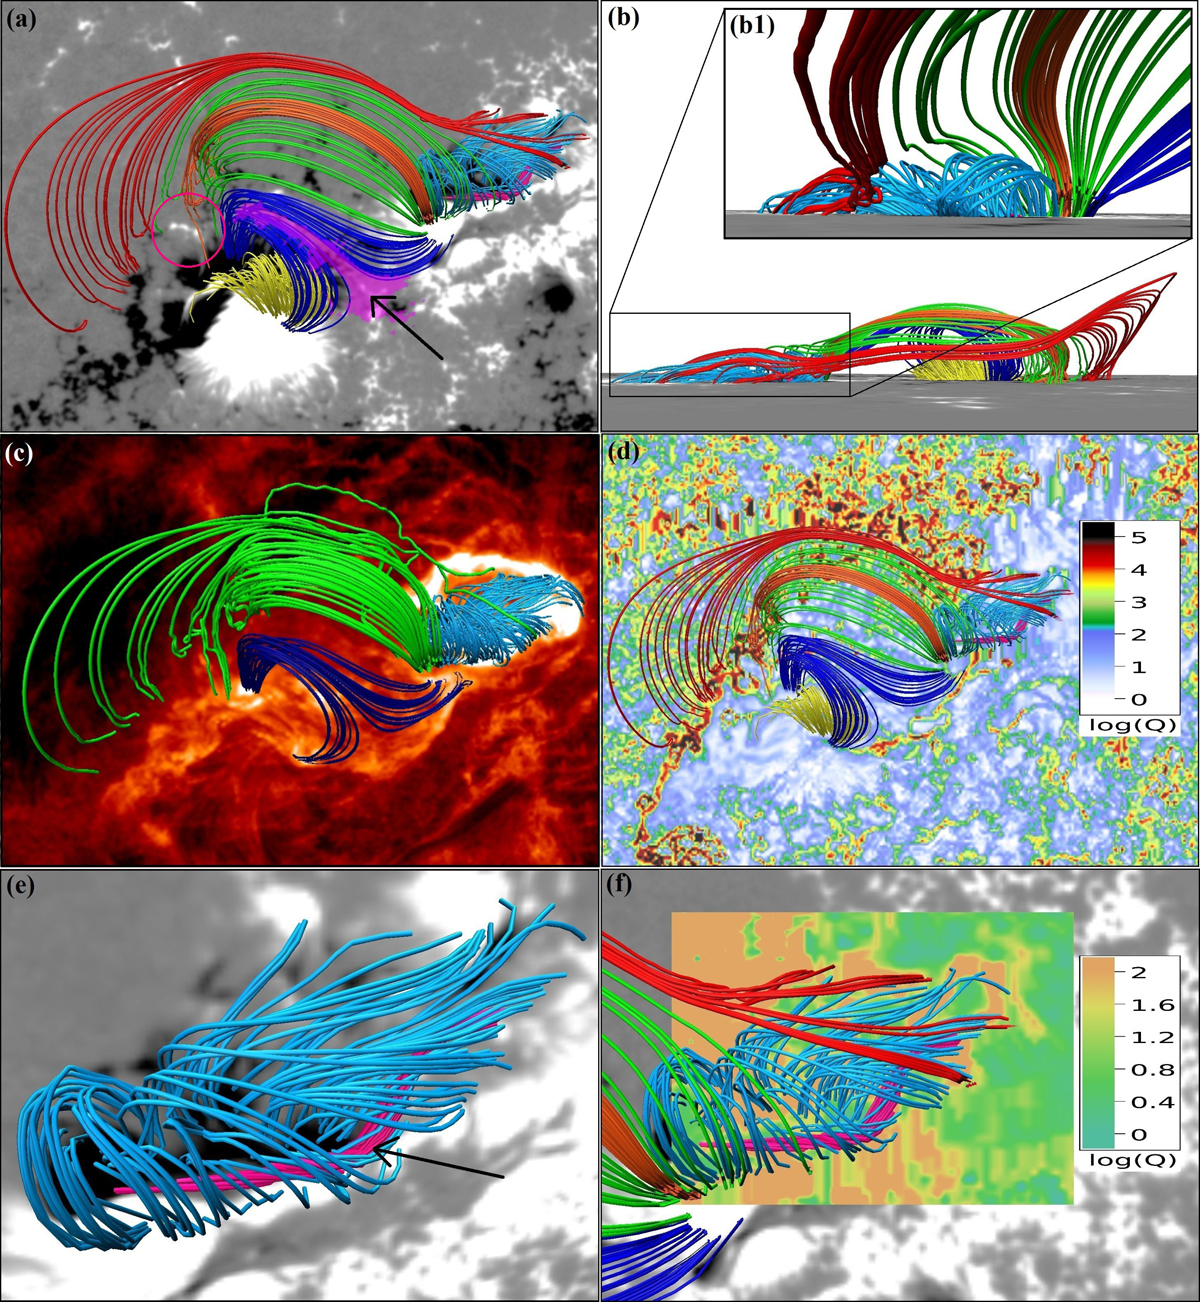
NLFFF-reconstructed coronal magnetic field configuration and distribution of the degree of squashing factor (Q). The sky-blue lines resemble a 3D fan-like structure. The pink lines within the sky-blue lines represent a flux rope. The red, green, and orange lines show connectivities between the northern positive-polarity flux region with the trailing negative-polarity regions, which resemble a 3D spine-like structure. The blue lines show an interesting structure where two sets of field lines, after originating from different regions, converge towards each other and terminate back on photosphere as parallel lines. The yellow lines show connectivity between the opposite-polarity flux regions within the trailing part of the active region. Panels a, c, and d display all the different sets of model coronal field lines from the top view. The pink circle in panel a indicates the LCO. Panel b shows all the model lines viewed from the northern boundary, i.e. from the top boundary of panel a. Panel b1 shows the fan-like structures viewed from underneath the spine-like lines. Panel e shows only the fan-like lines and the flux rope (indicated by the arrow). The pink patch in panel a (also indicated by the arrow) is characterised by log(Q)> 3.5. The backgrounds in panels a, e are co-temporal HMI LOS magnetogram saturated at ±500 G. The background in panel c is an AIA 304 Å image during the flare-peak showing the flare ribbons and other brightenings in the active region. The background in panel d represent a Q-map of the photosphere. Panel f focuses on the fan-spine-like structures along with the flux rope, from a top view. A part of the background in this panel shows a photospheric Q-map at the footpoints of the fan-spine-like lines. The colour-coding used for the Q-maps in panels d and f is shown in the respective panels.
Current usage metrics show cumulative count of Article Views (full-text article views including HTML views, PDF and ePub downloads, according to the available data) and Abstracts Views on Vision4Press platform.
Data correspond to usage on the plateform after 2015. The current usage metrics is available 48-96 hours after online publication and is updated daily on week days.
Initial download of the metrics may take a while.