Fig. 10.
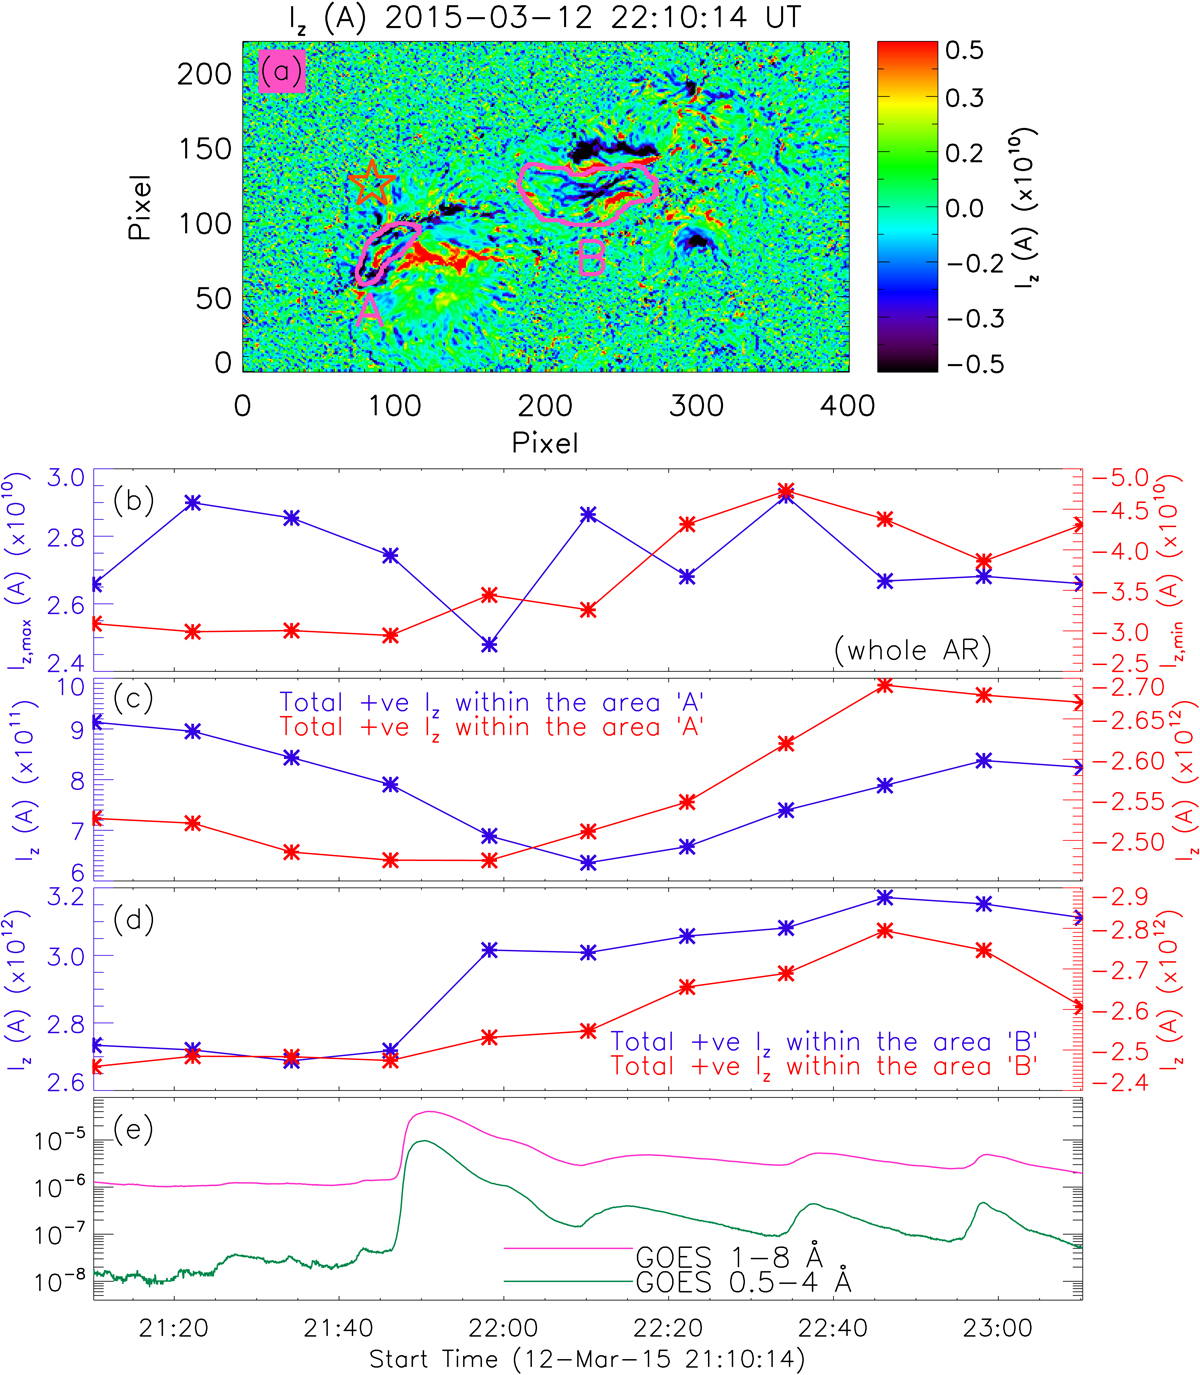
Download original image
Temporal evolution of photospheric vertical current (Iz). Panel a: same as Fig. 9a, except the Bz contours. Two regions specified as ‘A’ and ‘B’ are enclosed by the pink contours. The orange-coloured five-pointed star indicates the LCO. Panel b: temporal evolution of maximum and minimum vertical currents within the whole active region. Panels c and d: temporal evolution of total positive and negative photospheric vertical currents within the regions marked by ‘A’ and ‘B’, respectively. Panel e: GOES 1−8 and 0.5−4 Å channels SXR light curves.
Current usage metrics show cumulative count of Article Views (full-text article views including HTML views, PDF and ePub downloads, according to the available data) and Abstracts Views on Vision4Press platform.
Data correspond to usage on the plateform after 2015. The current usage metrics is available 48-96 hours after online publication and is updated daily on week days.
Initial download of the metrics may take a while.