Fig. 1.
Download original image
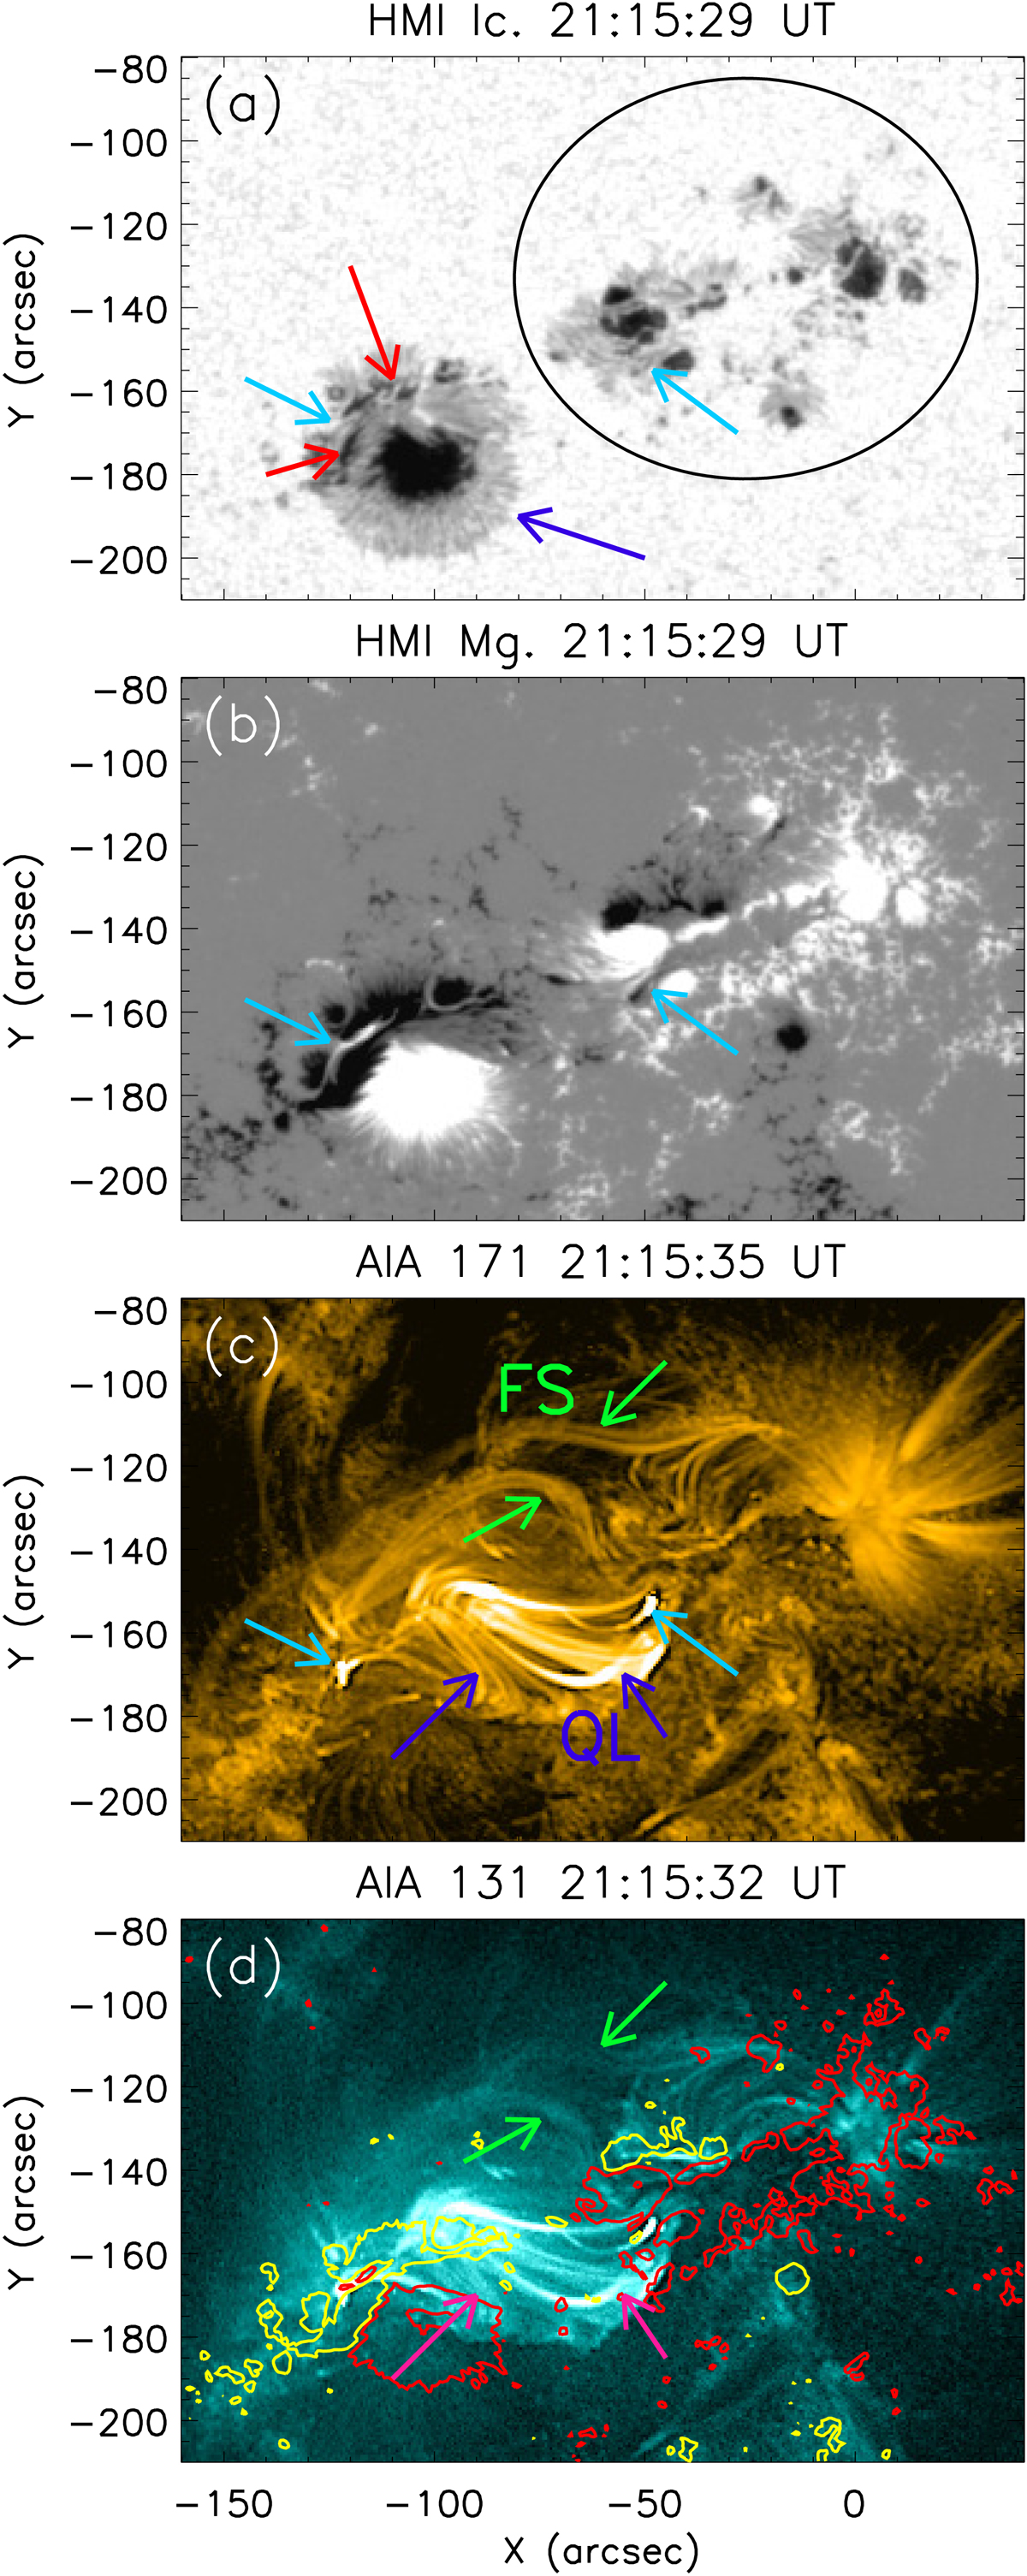
Photospheric and coronal overview of the active region NOAA 12297 on 12 March 2015. Panel a: white-light image. The black oval encircles a few small, distinct sunspots. The blue arrow indicates the most prominent sunspot group of the active region. The red arrows indicate a few narrow, elongated umbrae within the major sunspot group. Panel b: co-temporal magnetogram. The sky-coloured arrows indicate two localised magnetic patches within regions of opposite polarity. For correlation, we have plotted two sky-coloured arrows in panel a at exactly the same locations as the sky-coloured arrows in panel b. Panels c–d: EUV images in the AIA 171 and 131 Å channels, respectively. The deep-blue arrows in panel c and pink arrows in panel d indicate an interesting set of coronal loops (also marked ‘QL’ in panel c) which appear similar to quasi-separatrix layers (QSLs). The green arrows in panels c and d indicate another interesting set of coronal lines (also marked ‘FS’ in panel c), which appear similar to a fan-spine configuration. The sky-coloured arrows in panel c indicate two localised bright kernels, which are exactly co-spatial with the magnetic patches indicated by sky-coloured arrows in panels a and b. Co-temporal LOS magnetogram contours are overplotted in panel d. Contour levels are ±[500, 2000] G. Red and yellow contours refer to positive and negative magnetic flux, respectively.
Current usage metrics show cumulative count of Article Views (full-text article views including HTML views, PDF and ePub downloads, according to the available data) and Abstracts Views on Vision4Press platform.
Data correspond to usage on the plateform after 2015. The current usage metrics is available 48-96 hours after online publication and is updated daily on week days.
Initial download of the metrics may take a while.