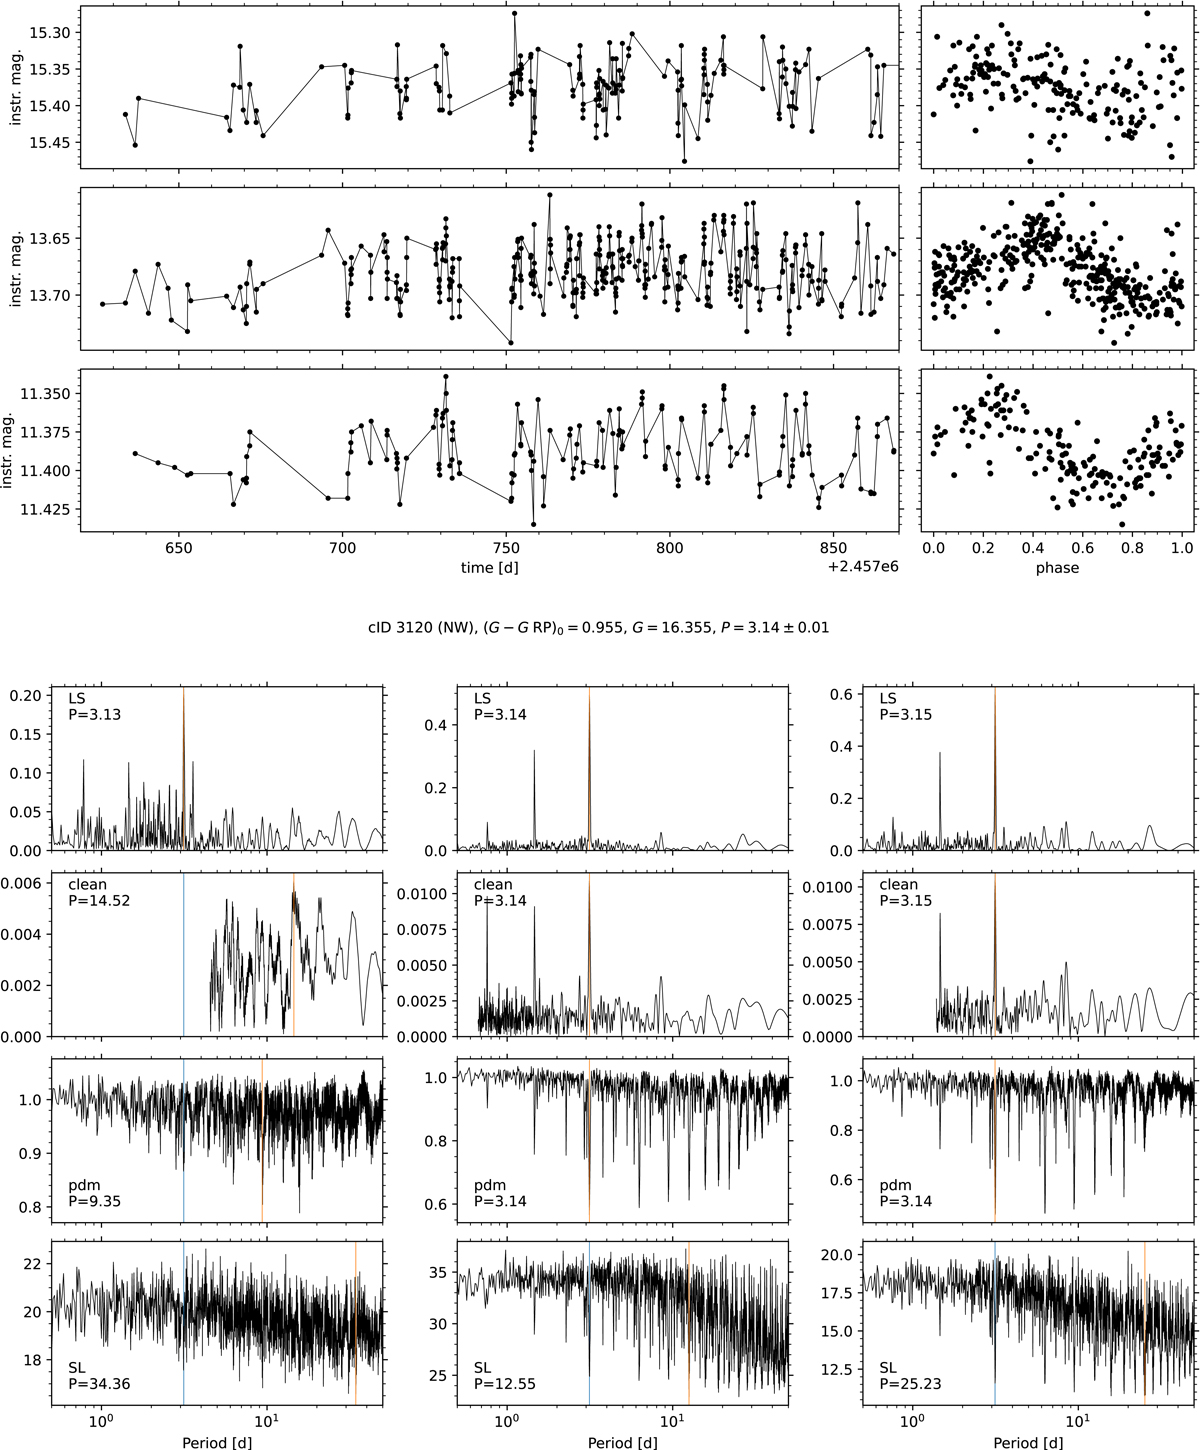
Fig. 3.
Download original image
Example of our overview diagram as produced for every star. The top panels show the full (left) and phase-folded light curves (right) for each exposure setting. From top to bottom, we show the V 24 s, V 120 s, Ic 600 s. At the bottom, we display the four periodograms for each exposure setting, now from left to right. In each periodogram, we mark the best period with an orange line and give its value at the left. The finally chosen period is marked with the blue line and noted in the text in the centre. We note that with the joint analysis, we are able to identify the true rotation period even in periodograms with higher alias peaks. The width of the blue line indicates the period uncertainty.
Current usage metrics show cumulative count of Article Views (full-text article views including HTML views, PDF and ePub downloads, according to the available data) and Abstracts Views on Vision4Press platform.
Data correspond to usage on the plateform after 2015. The current usage metrics is available 48-96 hours after online publication and is updated daily on week days.
Initial download of the metrics may take a while.