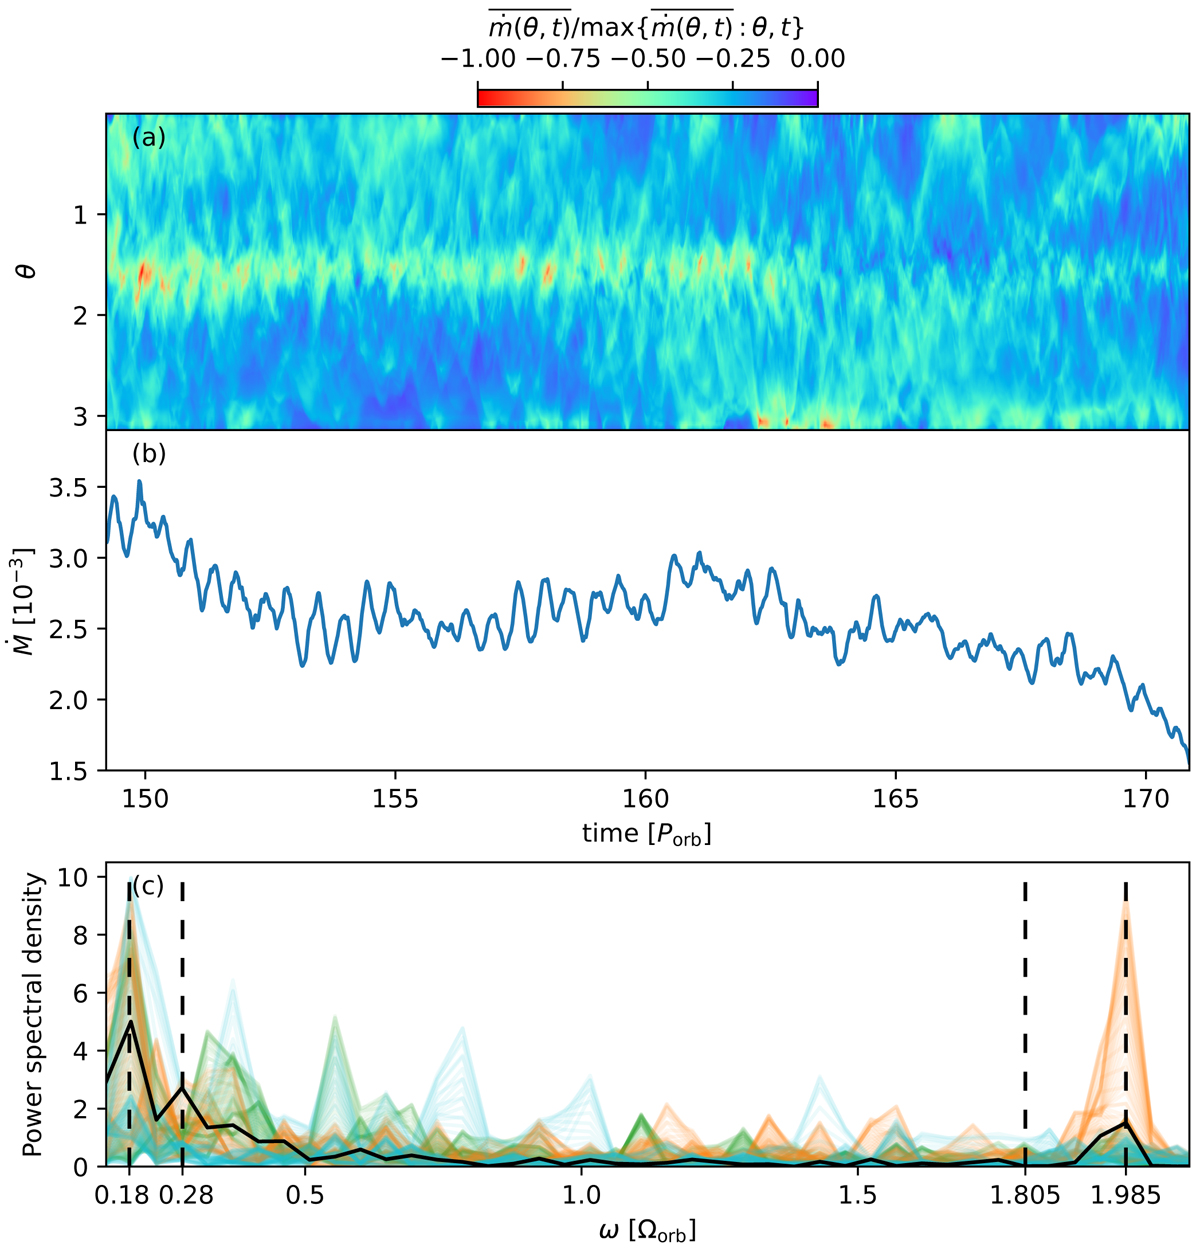
Fig. 9.
Download original image
Detailed view on the variability of mass flux for model A. Panel a: space-time diagram of the local mass flux through the inner boundary. Panel b: time evolution of the mass accretion rate onto the binary. Panel c: power spectral density of the total mass accretion rate onto the binary (black line) and of the mass flux at each colatitude (colored lines). Green lines correspond to the range 0 ≤ θ ≤ π/3, blue lines to the range 2π/3 ≤ θ ≤ π, and orange lines to the range π/3 ≤ θ ≤ 2π/3.
Current usage metrics show cumulative count of Article Views (full-text article views including HTML views, PDF and ePub downloads, according to the available data) and Abstracts Views on Vision4Press platform.
Data correspond to usage on the plateform after 2015. The current usage metrics is available 48-96 hours after online publication and is updated daily on week days.
Initial download of the metrics may take a while.