Fig. C.1.
Download original image
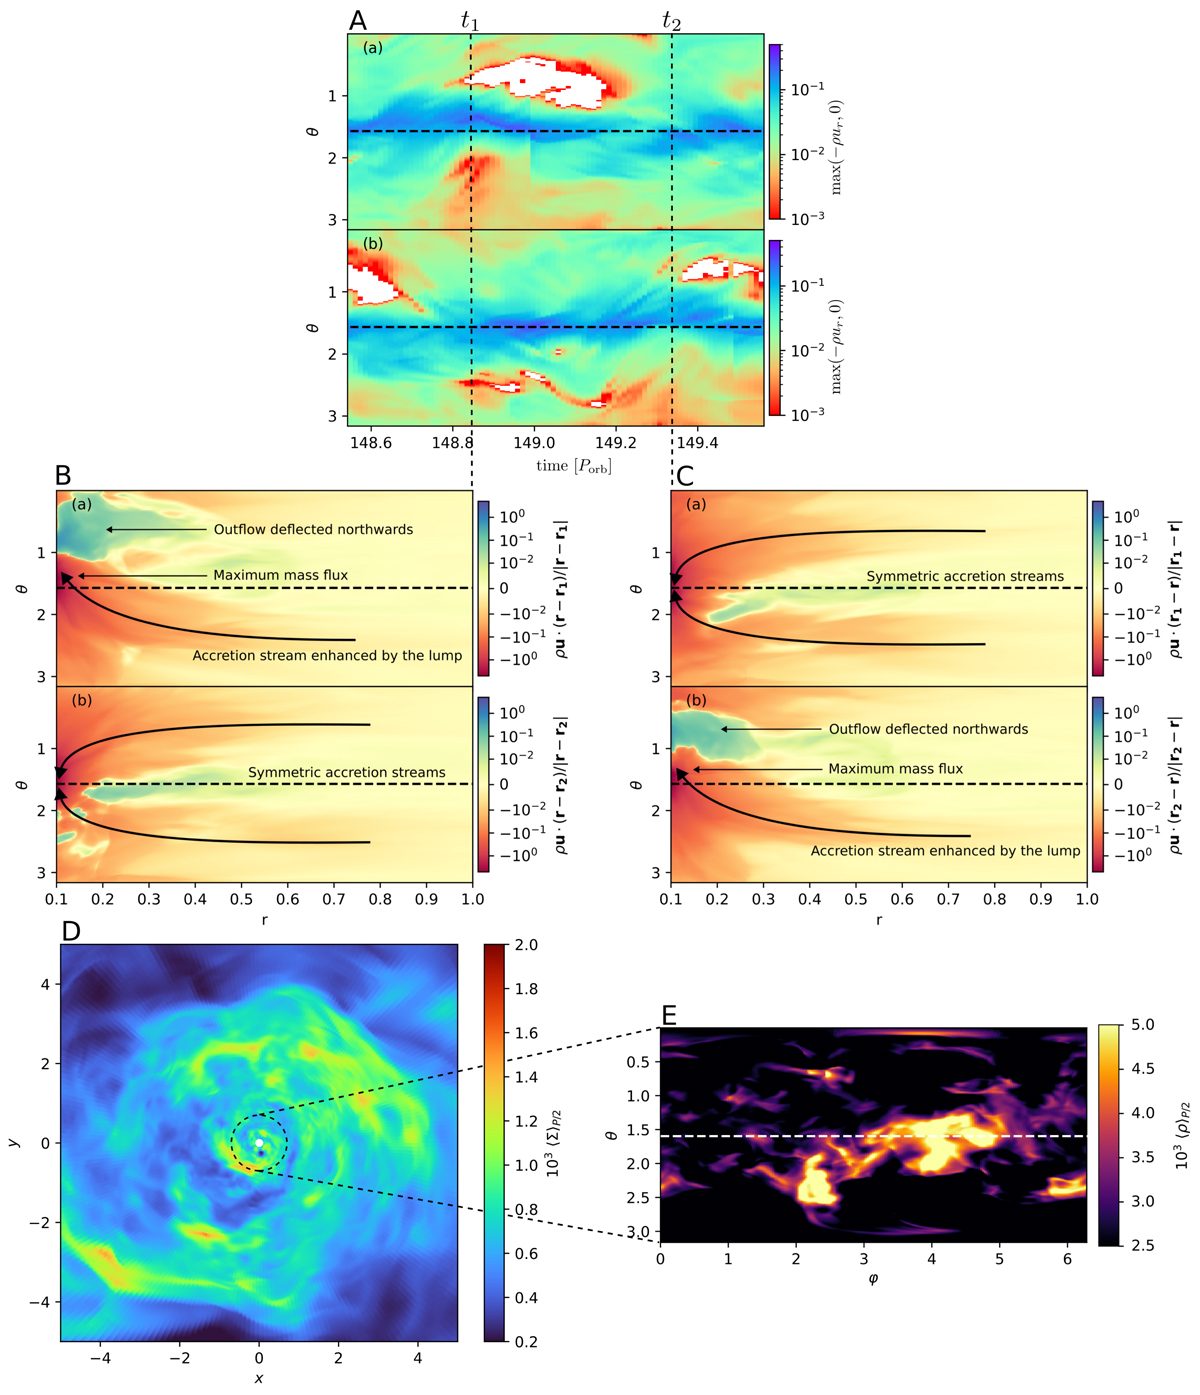
A: Space-time diagram of the mass flux onto the individual components of the binary for model A, azimuthally averaged in the range φ1 − π/12 ≤ φ1 ≤ φ1 + π/12 (a) and in the range φ2 − π/12 ≤ φ2 ≤ φ2 + π/12 (b). The horizontal dashed lines indicate the orbital plane θ = π/2. The two vertical dashed lines are separated by Porb/2 and indicate two successive times, t1 and t2, when the mass flux is maximum at the highest latitude. B: Mass flux toward and away from the individual cores, azimuthally averaged in the range φ1 − π/12 ≤ φ1 ≤ φ1 + π/12 (a) and in the range φ2 − π/12 ≤ φ2 ≤ φ2 + π/12 (b) as a function of colatitude and radius at t = t1. C: same as B but at t = t2. D: Surface density about the orbital plane (35) averaged over t1 ≤ t ≤ t2. The dashed circle indicates the approximate radial location of the overdensity responsible for the migrating accretion streams (r = 0.7). E: Density cross section in the θφ plane at r = 0.7 averaged over t1 ≤ t ≤ t2.
Current usage metrics show cumulative count of Article Views (full-text article views including HTML views, PDF and ePub downloads, according to the available data) and Abstracts Views on Vision4Press platform.
Data correspond to usage on the plateform after 2015. The current usage metrics is available 48-96 hours after online publication and is updated daily on week days.
Initial download of the metrics may take a while.