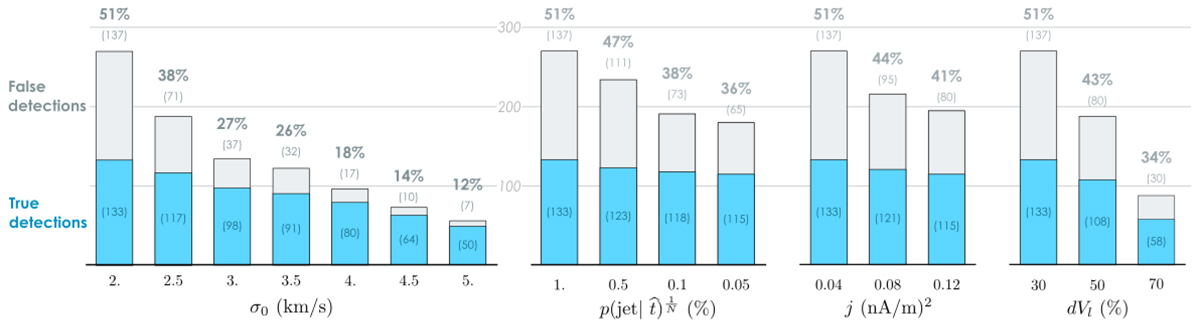
Fig. A.1.
Download original image
Variation of the number of detections depending on the input parameter values. Among the detections, the grey bars indicate false detections while the blue bars are true-positive detections. The background grid (horizontal grey lines) is to guide the eye for the total number of detections (true and false). The FP rate is also written at the top of each bar.
Current usage metrics show cumulative count of Article Views (full-text article views including HTML views, PDF and ePub downloads, according to the available data) and Abstracts Views on Vision4Press platform.
Data correspond to usage on the plateform after 2015. The current usage metrics is available 48-96 hours after online publication and is updated daily on week days.
Initial download of the metrics may take a while.