Fig. 8.
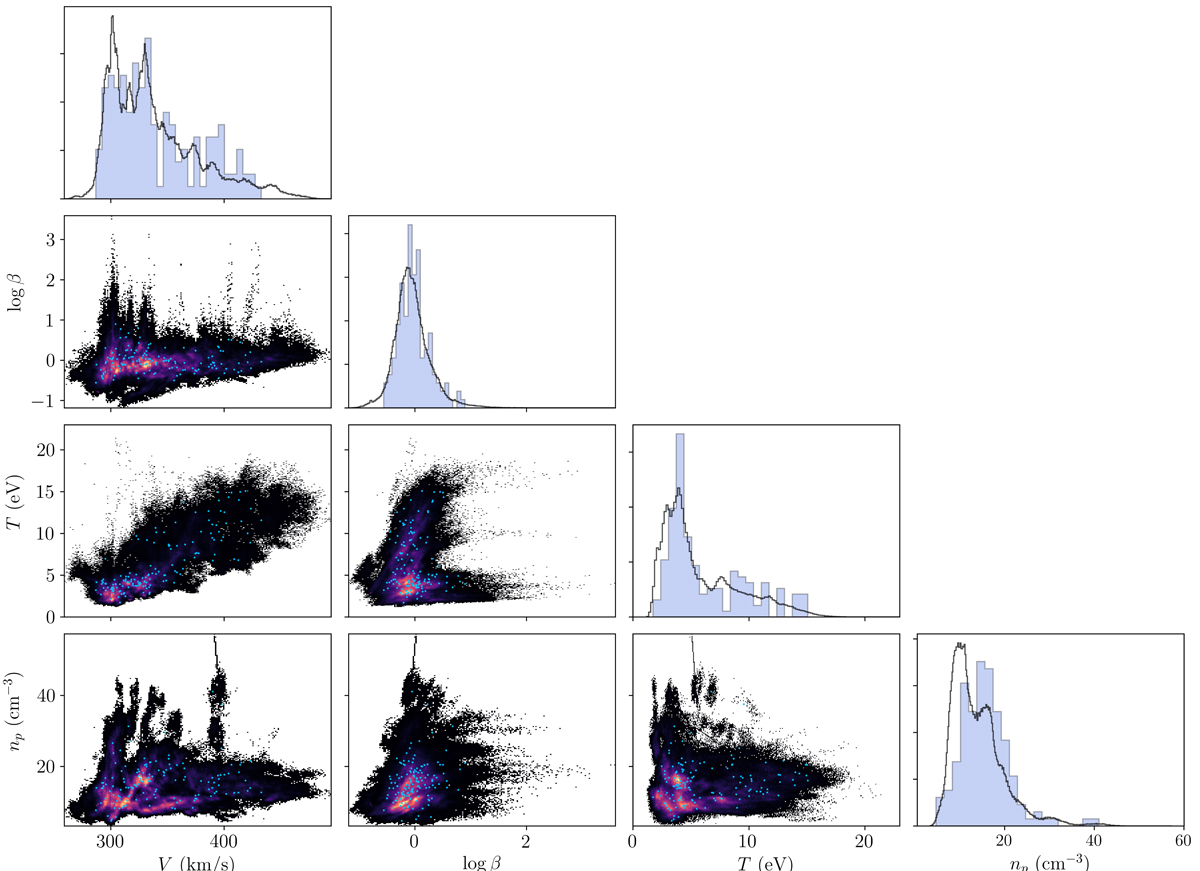
Download original image
Solar wind conditions upon the occurrence of magnetic reconnection. The corner plot shows the joint 2D distributions of the solar wind speed V, plasma parameter log β, temperature T, and density n for the whole period of measurements. The superimposed blue dots indicate the value of these parameters around the intervals where magnetic reconnection was observed. The top panels of the corner plot then show the 1D histograms of these quantities for the whole month (in black) and for reconnection inflow conditions (in blue).
Current usage metrics show cumulative count of Article Views (full-text article views including HTML views, PDF and ePub downloads, according to the available data) and Abstracts Views on Vision4Press platform.
Data correspond to usage on the plateform after 2015. The current usage metrics is available 48-96 hours after online publication and is updated daily on week days.
Initial download of the metrics may take a while.