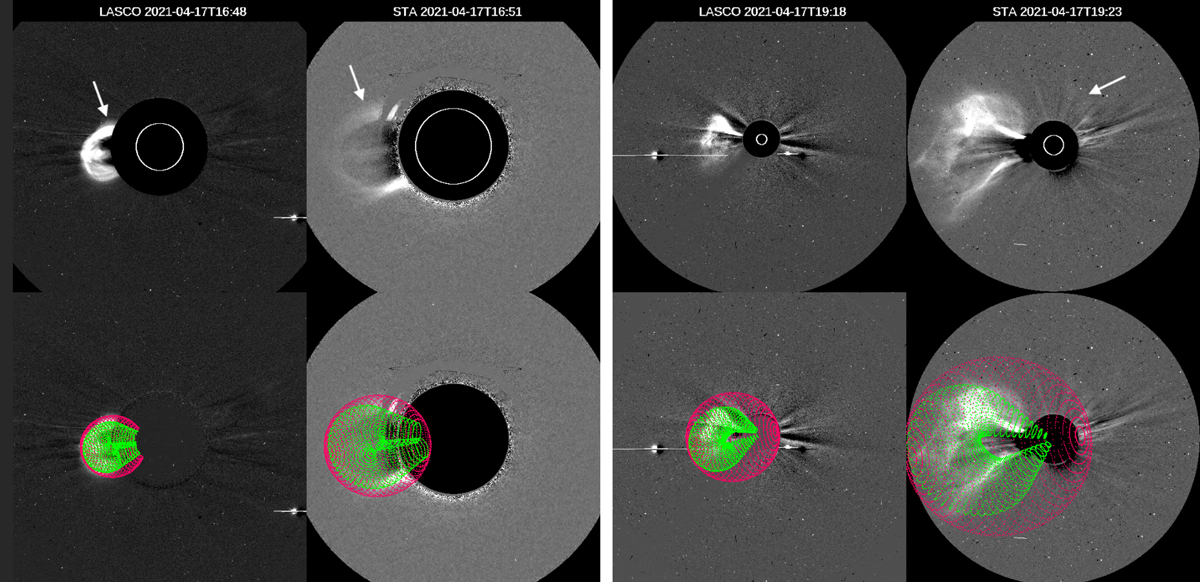
Fig. 7.
Download original image
Base-difference images of the coronagraph observations by SOHO/LASCO/C2 and STEREO A/COR1 (left) and LASCO/C3 and STEREO A/COR2 (right) at different times. The green (red) mesh corresponding to the 3D reconstruction of the CME (CME-driven shock) is shown in the lower panels. The white arrows indicate the signatures of the CME-driven shock.
Current usage metrics show cumulative count of Article Views (full-text article views including HTML views, PDF and ePub downloads, according to the available data) and Abstracts Views on Vision4Press platform.
Data correspond to usage on the plateform after 2015. The current usage metrics is available 48-96 hours after online publication and is updated daily on week days.
Initial download of the metrics may take a while.