Fig. 5.
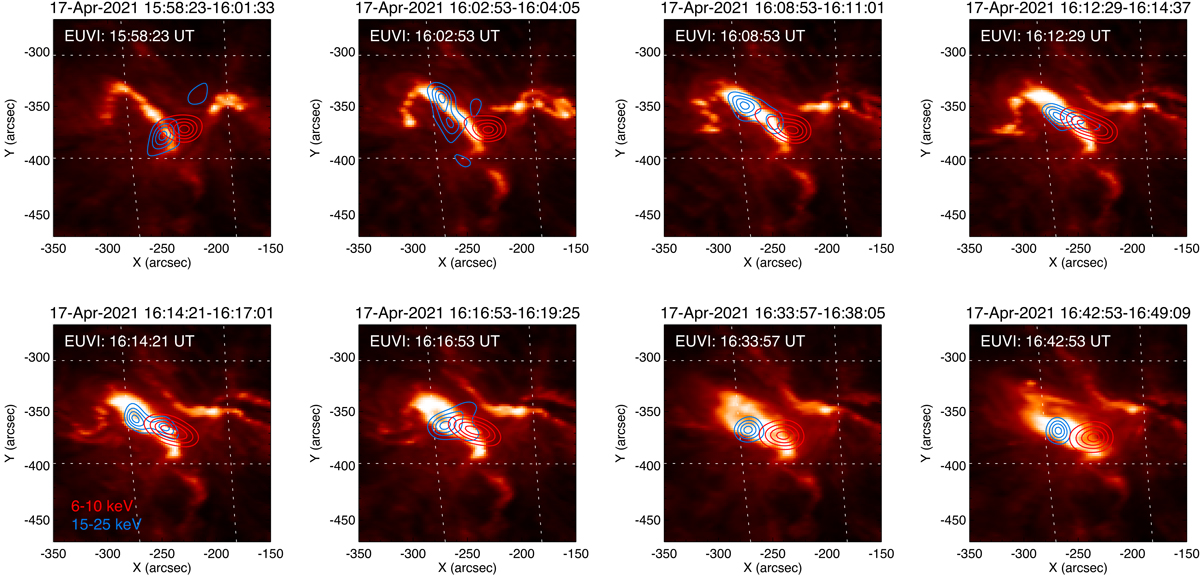
Download original image
Flare evolution as seen in a series of STIX HXR images overlaid on STEREO A EUVI 304 Å images that have been rotated so that they correspond to the viewpoint of Solar Orbiter. Depicted are the coronal thermal source (red contours) and the chromospheric nonthermal footpoints (blue contours) reconstructed with the expectation maximization algorithm. The integration times (UT at the Sun) correspond to the eight nonthermal HXR peaks with the highest number of counts above 15 keV. Additionally, the observation times of the EUVI images are shown. For reference, a longitude-latitude grid (in Stonyhurst coordinates) with a spacing of 5° is overplotted.
Current usage metrics show cumulative count of Article Views (full-text article views including HTML views, PDF and ePub downloads, according to the available data) and Abstracts Views on Vision4Press platform.
Data correspond to usage on the plateform after 2015. The current usage metrics is available 48-96 hours after online publication and is updated daily on week days.
Initial download of the metrics may take a while.