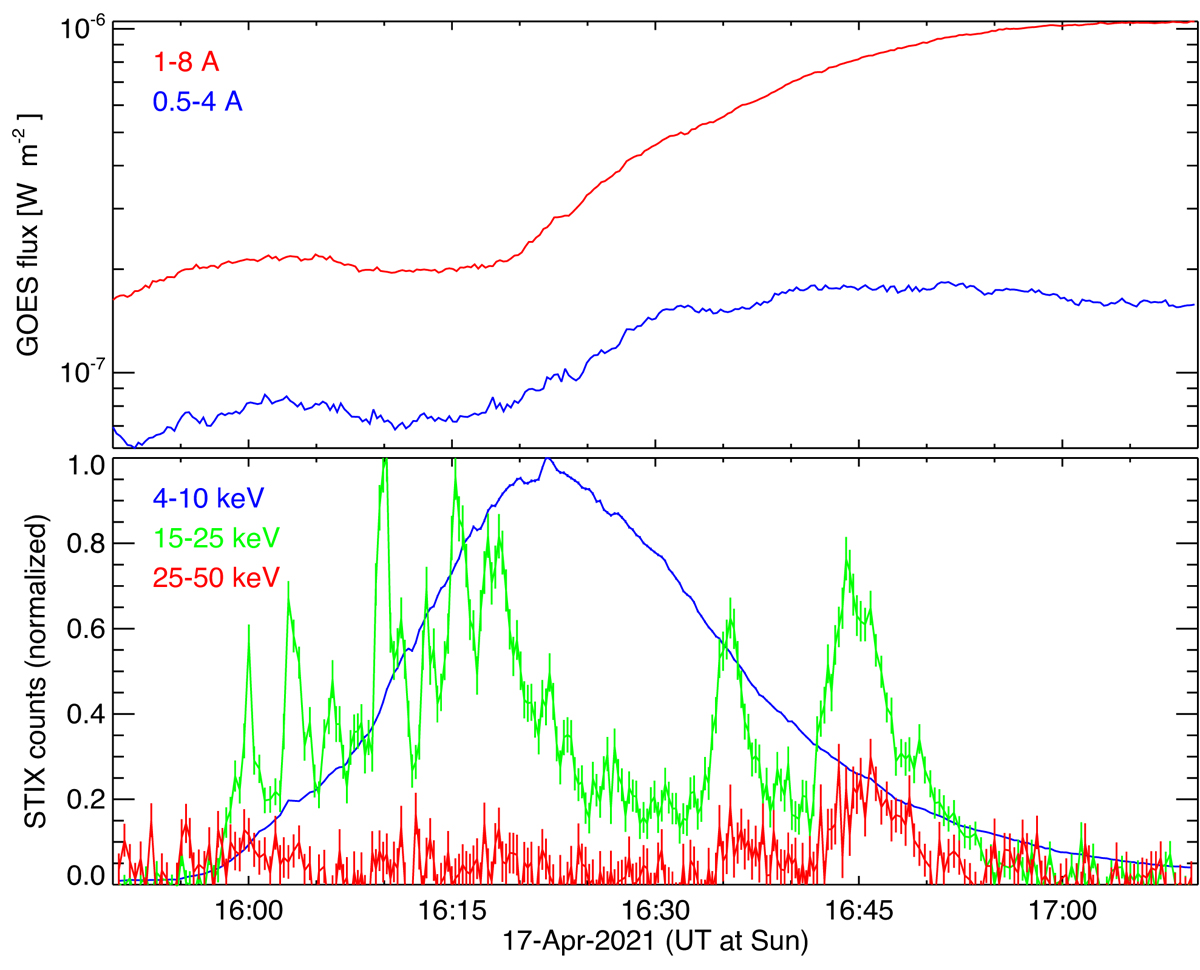
Fig. 4.
Download original image
X-ray observations of the associated flare. Top: Soft X-ray fluxes as recorded by GOES-16. Bottom: Normalized background-subtracted STIX count rates integrated over two different energy bands. Note the gradual evolution of the thermal emission at 4–10 keV (blue) as opposed to the multiple nonthermal spikes seen at 15–25 keV (green) and at 25–50 keV (red; multiplied by 0.3 for clarity). For both GOES and STIX, times have been shifted so that they refer to UT at the Sun.
Current usage metrics show cumulative count of Article Views (full-text article views including HTML views, PDF and ePub downloads, according to the available data) and Abstracts Views on Vision4Press platform.
Data correspond to usage on the plateform after 2015. The current usage metrics is available 48-96 hours after online publication and is updated daily on week days.
Initial download of the metrics may take a while.