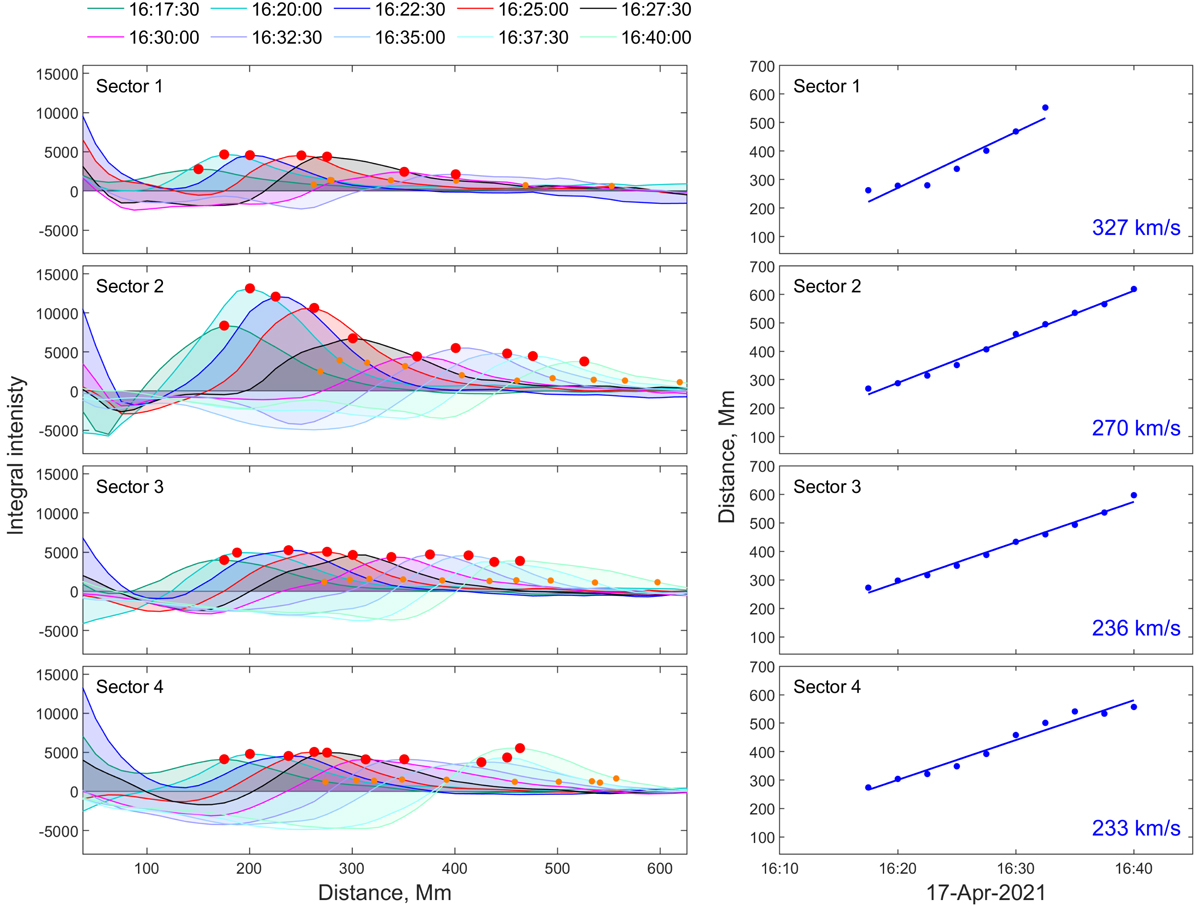
Fig. C.1.
Download original image
Kinematics of the EUV wave observed on the solar disk. Left panels: Perturbation profiles demonstrating the EUV wave propagation in the four angular sectors considered. Big red markers indicate the peak amplitude of each profile, while small orange markers show the estimated wavefront locations extracted at 30% of the peak value, which we use for the assessment of the EUV wave kinematics presented in the right panels. A movie accompanying the figure is available online (movie2) and represents the dynamics of the intensity perturbation profiles. Right panels: Distance-time profiles of the EUV wave fronts for the four angular sectors. Dots indicate data points, and the solid lines show the linear fit.
Current usage metrics show cumulative count of Article Views (full-text article views including HTML views, PDF and ePub downloads, according to the available data) and Abstracts Views on Vision4Press platform.
Data correspond to usage on the plateform after 2015. The current usage metrics is available 48-96 hours after online publication and is updated daily on week days.
Initial download of the metrics may take a while.