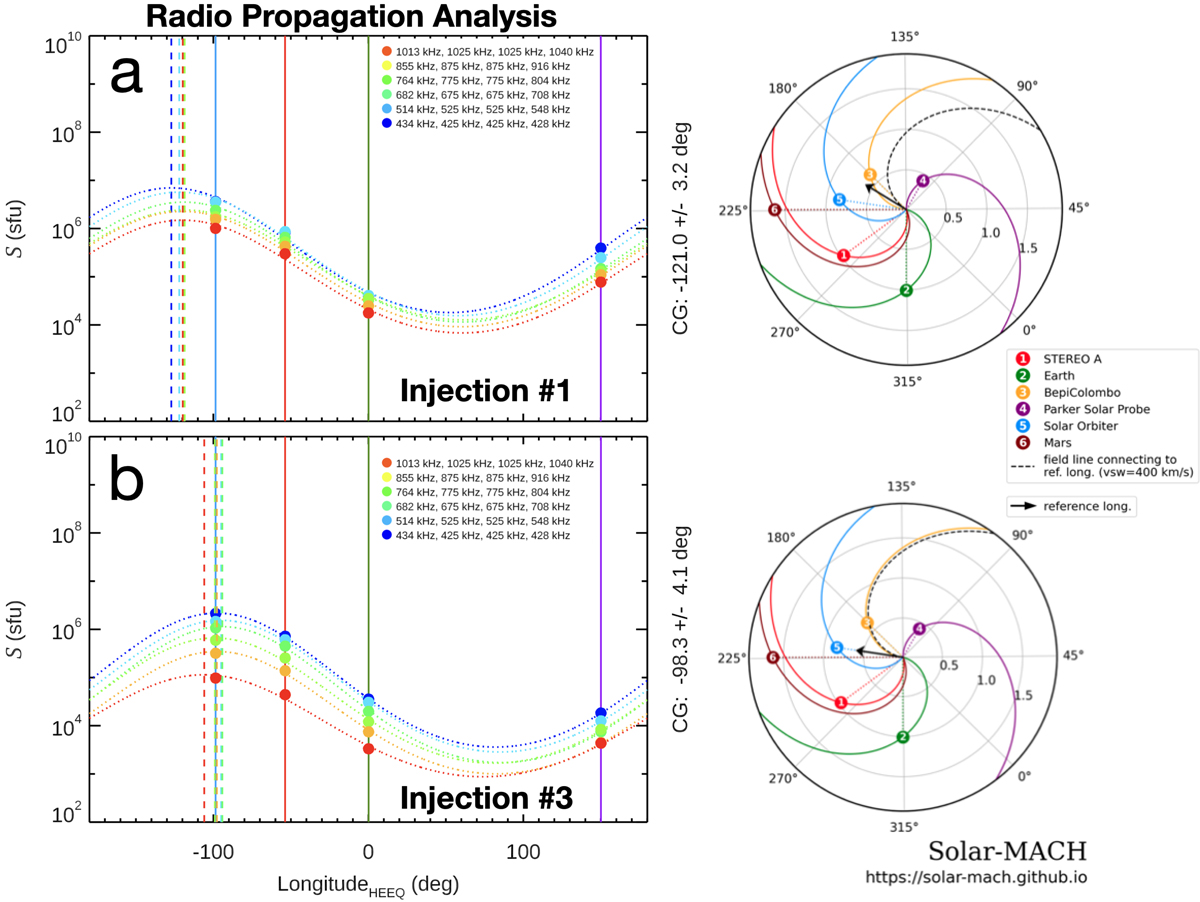
Fig. B.1.
Download original image
Radio propagation analysis of the TIII(1) and TIII (3). Left: Calibrated peak radio fluxes as a function of spacecraft locations λ for six frequency channels denoted by the colored circles. Dotted lines are results of the Eq. (B.1) fitting. Vertical dashed lines indicate modeled direction of the peak fluxes. Right: Longitudinal spacecraft constellation plots like in Fig. 1 (left) but with reference longitudes corresponding to the results of the radio propagation analysis for TIII(1) (top) and TIII(3) (bottom).
Current usage metrics show cumulative count of Article Views (full-text article views including HTML views, PDF and ePub downloads, according to the available data) and Abstracts Views on Vision4Press platform.
Data correspond to usage on the plateform after 2015. The current usage metrics is available 48-96 hours after online publication and is updated daily on week days.
Initial download of the metrics may take a while.