Fig. 22.
Download original image
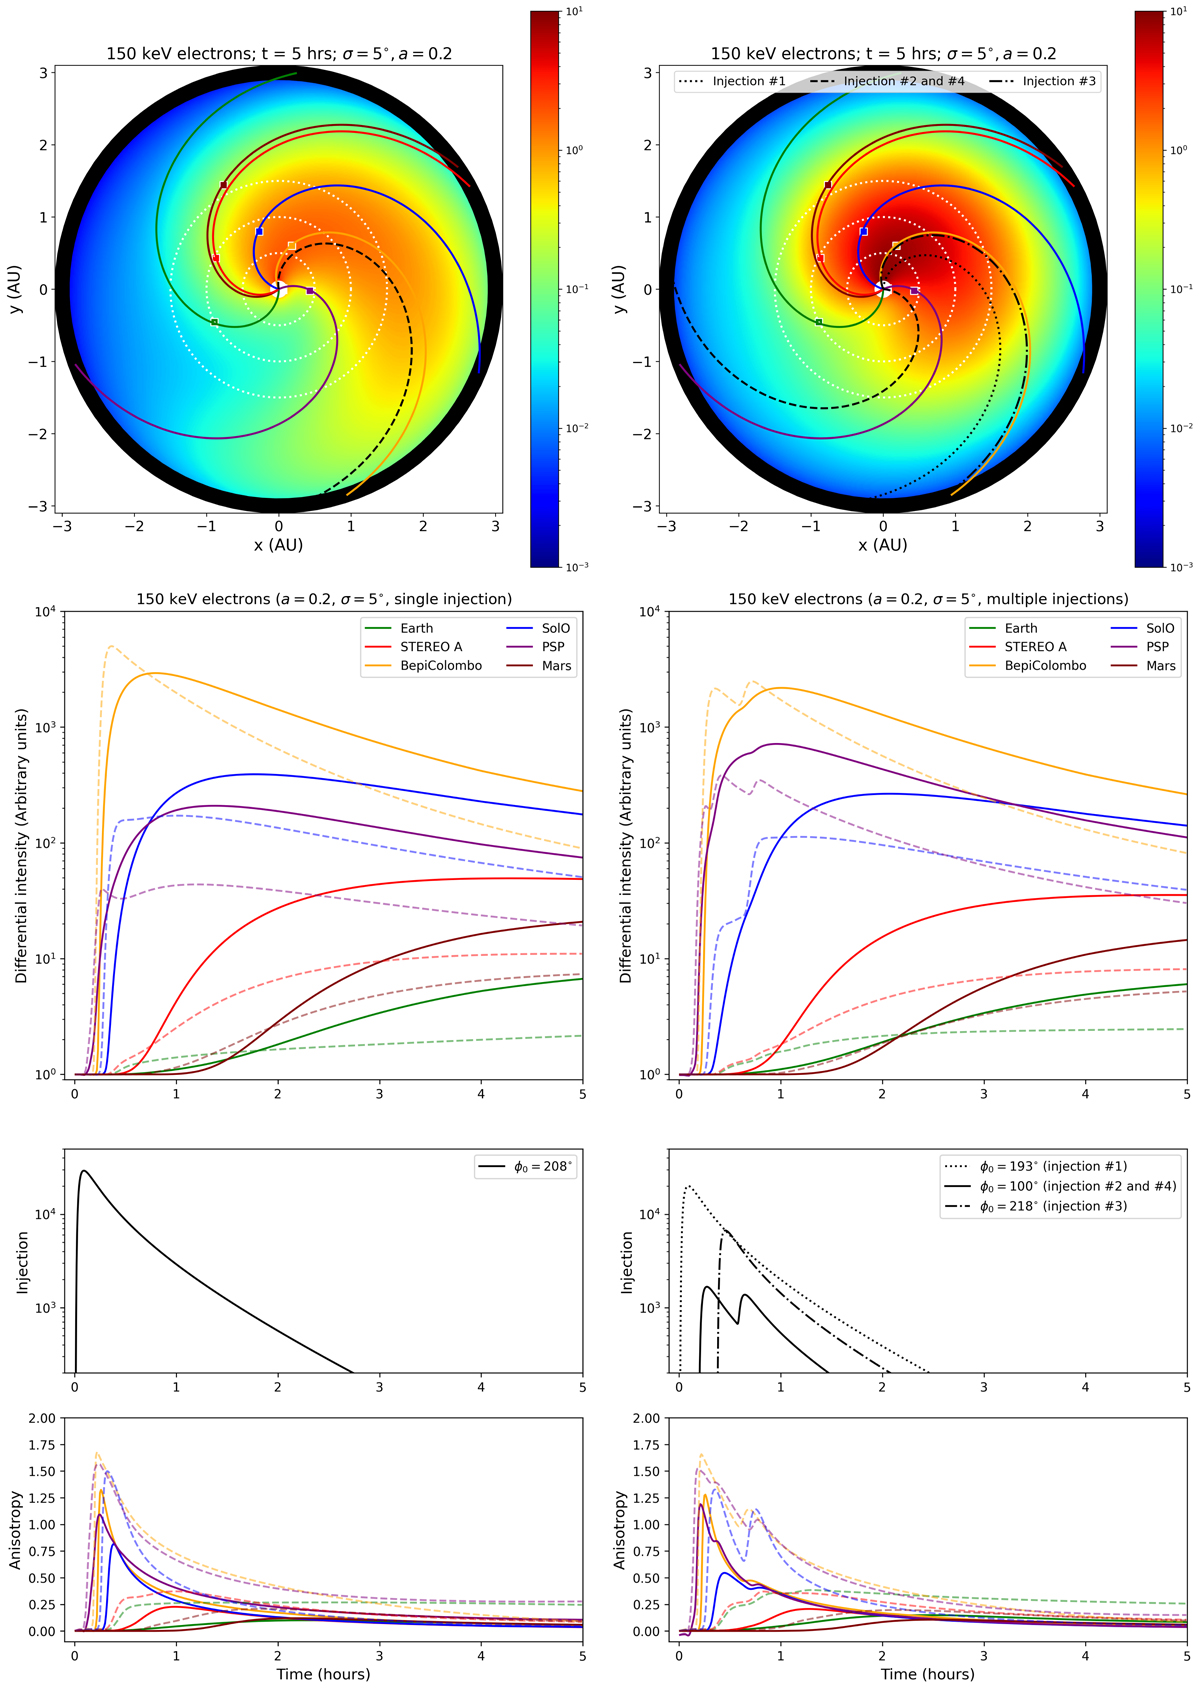
Transport modeling results for 150 keV electrons. The left panels represent the standard case of a single SEP injection into interplanetary space, while the right panels are for multiple injections. The top panels are normalized contour plots of the SEP intensity at five hours after the initial injection, while the bottom panels show the resulting particle intensities, as a function of time, at a number of spacecraft positions, the different SEP injections, and the resulting particle anisotropies. More details are given in the main text.
Current usage metrics show cumulative count of Article Views (full-text article views including HTML views, PDF and ePub downloads, according to the available data) and Abstracts Views on Vision4Press platform.
Data correspond to usage on the plateform after 2015. The current usage metrics is available 48-96 hours after online publication and is updated daily on week days.
Initial download of the metrics may take a while.