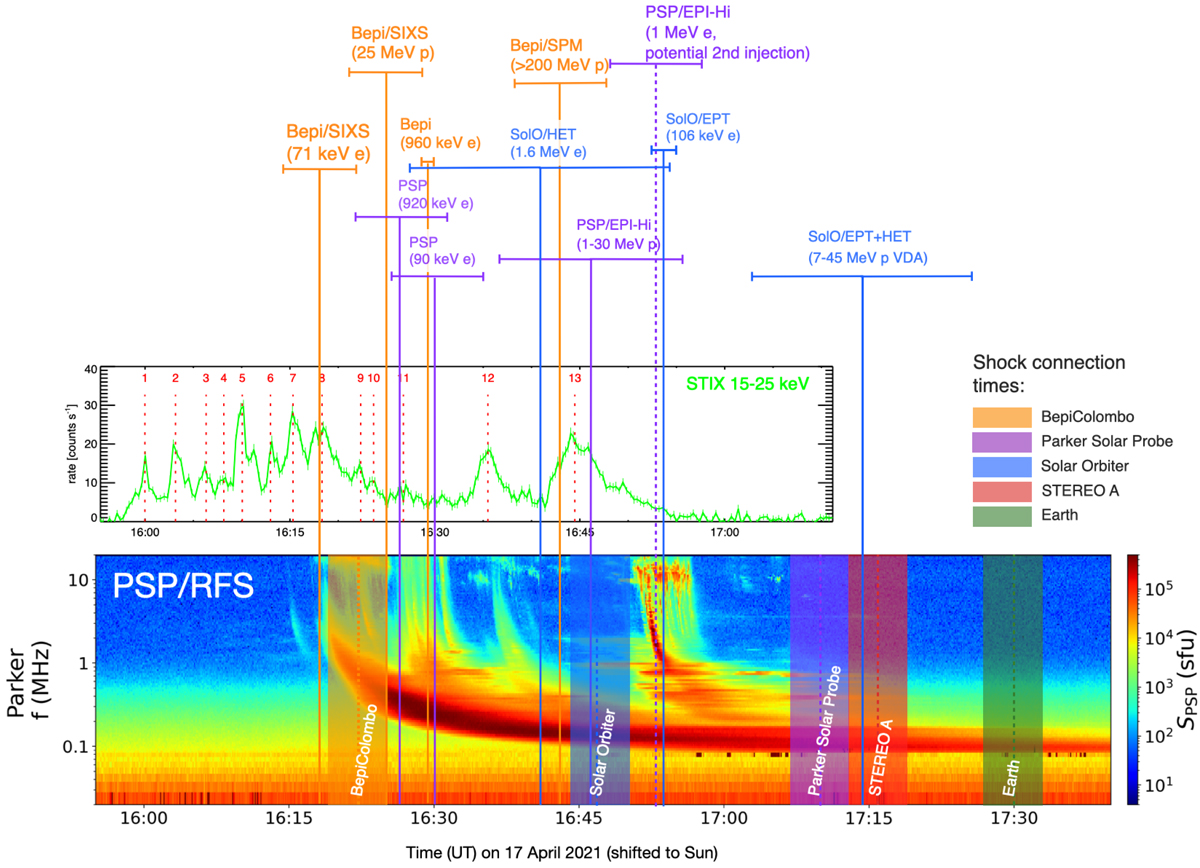
Fig. 21.
Download original image
Inferred SEP injection times (vertical lines with temporal error bars on top) overplotted on the radio spectrogram as observed by PSP/RFS and the 15–25 keV X-ray observations by Solar Orbiter/STIX. All times have been shifted to the Sun by assuming the propagation time of the emission to the respective spacecraft. The shaded ranges mark the times when the spacecraft establish a magnetic connection with the CME-driven shock including an uncertainty of ±3 min.
Current usage metrics show cumulative count of Article Views (full-text article views including HTML views, PDF and ePub downloads, according to the available data) and Abstracts Views on Vision4Press platform.
Data correspond to usage on the plateform after 2015. The current usage metrics is available 48-96 hours after online publication and is updated daily on week days.
Initial download of the metrics may take a while.