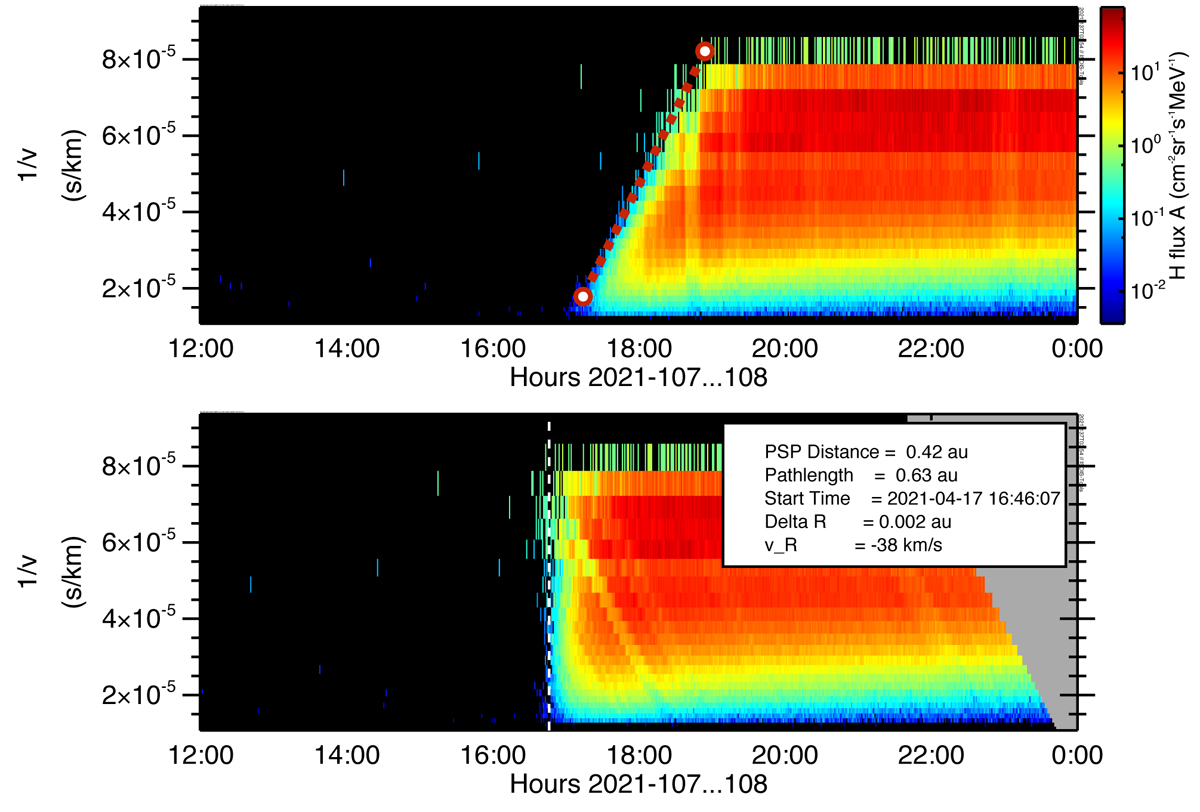
Fig. 17.
Download original image
VDA of protons from PSP EPI-Hi/LETA from 1 to 30 MeV. Top panel: “By-eye” fit to the onset of the observed intensities as a function of 1/v and time (red line). Bottom panel: Same data, but with the velocity dispersion removed. The legend provides the derived path length and injection times corresponding to the fit line.
Current usage metrics show cumulative count of Article Views (full-text article views including HTML views, PDF and ePub downloads, according to the available data) and Abstracts Views on Vision4Press platform.
Data correspond to usage on the plateform after 2015. The current usage metrics is available 48-96 hours after online publication and is updated daily on week days.
Initial download of the metrics may take a while.