Fig. 12.
Download original image
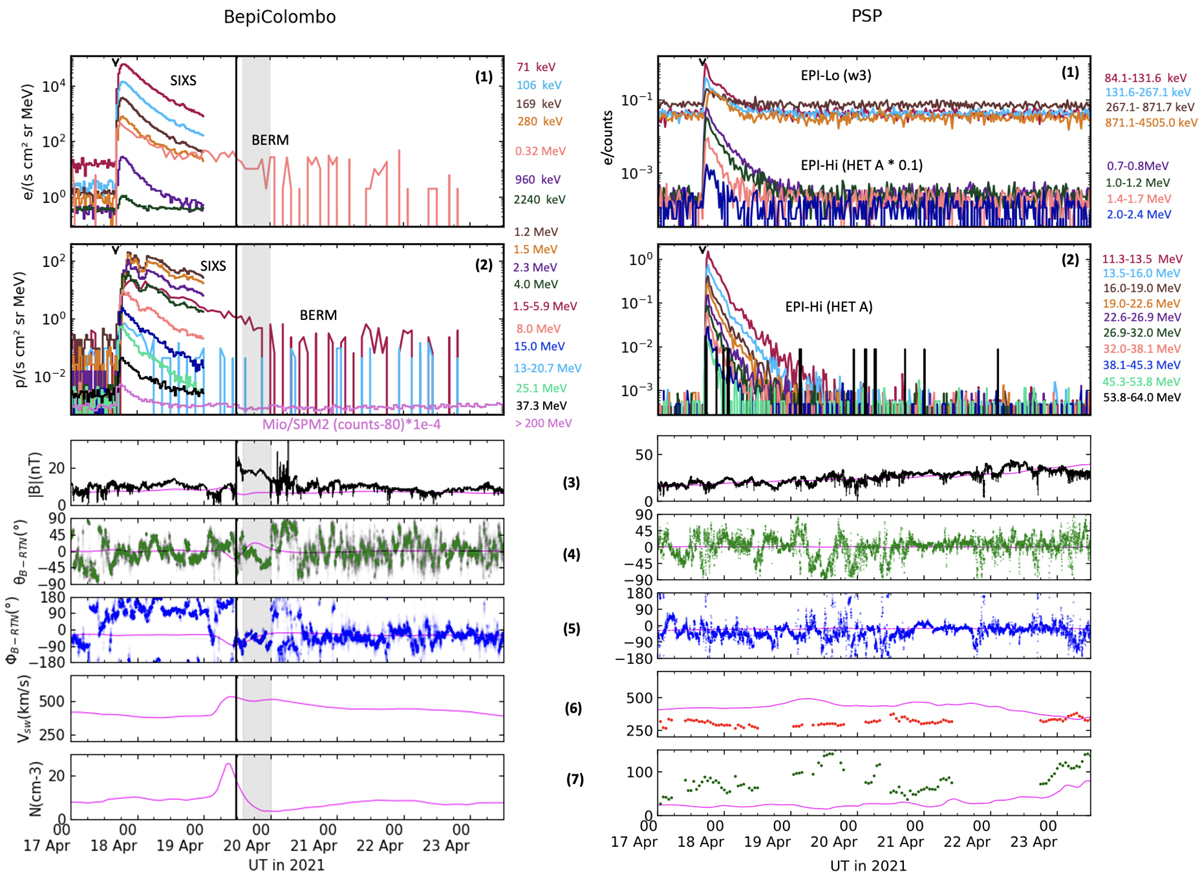
In situ SEP time profiles as well as plasma and magnetic field observations by BepiColombo (left) and PSP (right). Top: Energetic electron and proton temporal profiles observed from several energy channels and instruments. For SIXS, we use fluxes detected in side 2 of the detector. The flare eruption time is represented by the arrow on the upper x-axes. The vertical solid line and gray shaded area, respectively, indicate IP shock and ejecta transit observed by BepiColombo. Bottom: In situ plasma and magnetic field observations. The panels present, from top to bottom, the magnetic field magnitude, the magnetic field latitudinal and azimuthal angles, θB − RTN and ϕB − RTN, the solar wind speed, and the proton density, where RTN stands for RTN coordinates (IP structures as described in top panel). The pink lines represent the ENLIL simulation results.
Current usage metrics show cumulative count of Article Views (full-text article views including HTML views, PDF and ePub downloads, according to the available data) and Abstracts Views on Vision4Press platform.
Data correspond to usage on the plateform after 2015. The current usage metrics is available 48-96 hours after online publication and is updated daily on week days.
Initial download of the metrics may take a while.