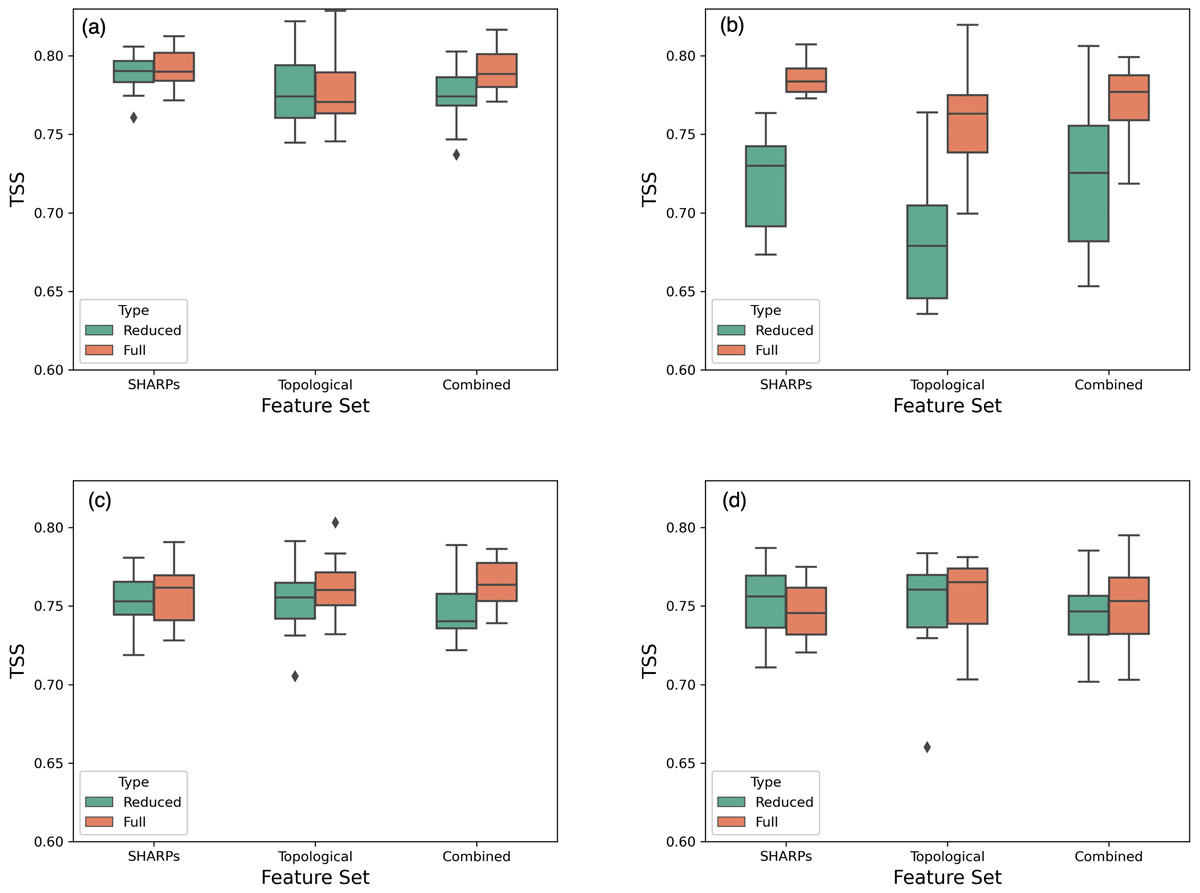
Fig. 5.
Download original image
TSS score comparison in the form of box-whiskers plots for four ML models. The models are trained on the three feature sets and their PCA reduced counterparts over ten trials: (a) Logistic Regression model; (b) ERT model; (c) MLP model; (d) LSTM model. The central line each box represents the median TSS score while the top and bottom edge of the boxes represent the 25 and 75 percentiles over the ten trials. The whiskers are the upper and lower bounds for the scores in each experiment set to be 1.5 times the interquartile range, and the dots represent the outliers defined as points outside of the specified whisker length. After PCA reduction, the SHARPs feature set is reduced from 20 to 9 features, the topological set from 20 to 3 features, and the combined set from 40 to 11 features. For all models except for the ERT, the reduced feature set does just as well as the complete feature set.
Current usage metrics show cumulative count of Article Views (full-text article views including HTML views, PDF and ePub downloads, according to the available data) and Abstracts Views on Vision4Press platform.
Data correspond to usage on the plateform after 2015. The current usage metrics is available 48-96 hours after online publication and is updated daily on week days.
Initial download of the metrics may take a while.