Fig. 3.
Download original image
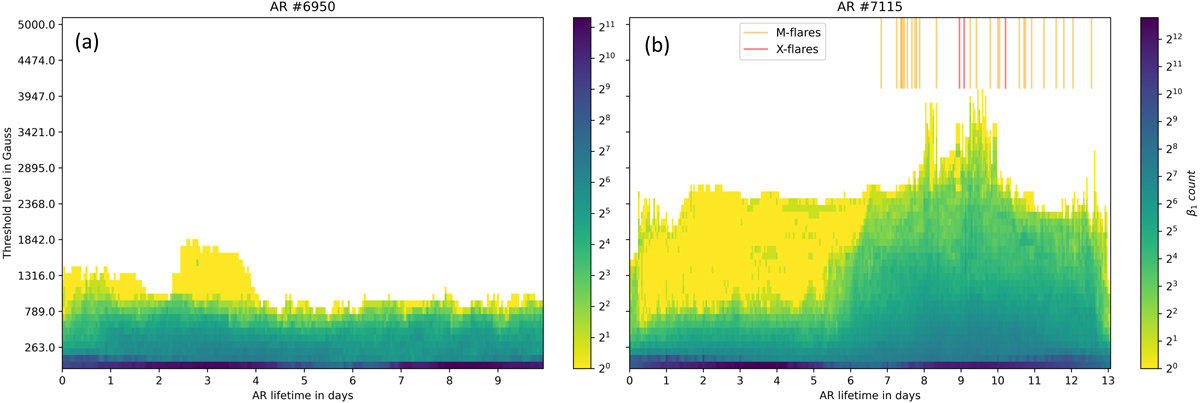
Contours of β1 as a function of time for sublevel thresholds Br = 0 to 5000 G for two ARs. Panel (a) shows ten days of evolution for SHARP 6950 (NOAA AR 12636) where day 0 is 2300 UT on 14 February 2017. No flares were observed. Panel (b) shows thirteen days of evolution for SHARP 7115 (NOAA AR 12673) where day 0 is 0900 UT on 28 August 2017. In this case, the threshold for β1 ≳ 10 jumps up about two days before the first M-class flare (indicated by orange vertical bar), and nearly four days before the first X-class eruption (red vertical bar) that occurred at 0857 UT on 6 September 2017. The Br strength thresholds, s0 = 263 G, s1 = 789 G, ..., s8 = 4473 G and s9 = 5000 G, correspond to the tick marks on the ordinate. The breadth of the color bar scale is the result of the large number of small-scale holes from noise in the image.
Current usage metrics show cumulative count of Article Views (full-text article views including HTML views, PDF and ePub downloads, according to the available data) and Abstracts Views on Vision4Press platform.
Data correspond to usage on the plateform after 2015. The current usage metrics is available 48-96 hours after online publication and is updated daily on week days.
Initial download of the metrics may take a while.