Fig. 4
Download original image
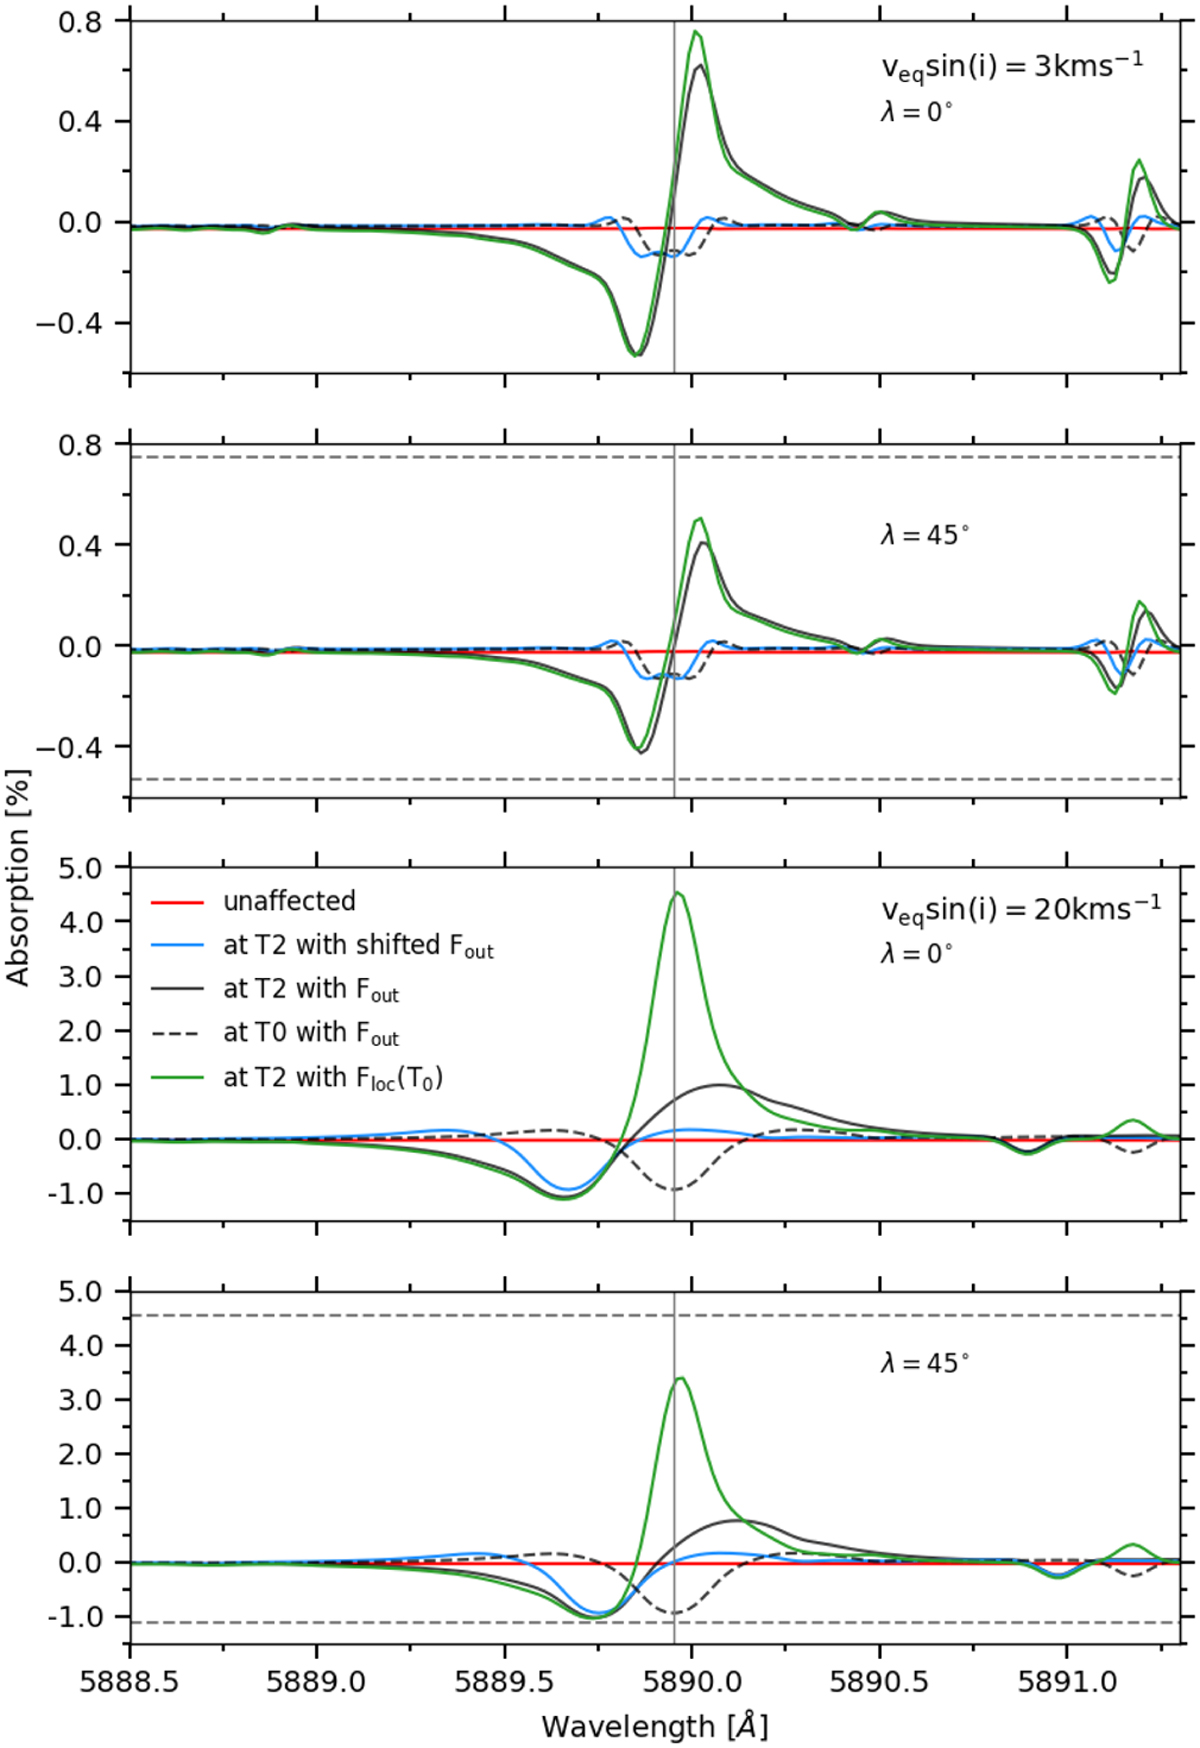
Excess absorption spectra without thermospheric sodium, as a function of wavelength in the stellar rest frame, computed with the different reference spectra mentioned in Sect. 3.1. We display results for two veq sin(i) values as well as for two sky-projected spin-orbit angles. The vertical grey lines mark the transition wavelength of Na I D2. For comparison the horizontal dashed grey lines mark the highest and lowest values of the POLD, obtained for λ = 0°.
Current usage metrics show cumulative count of Article Views (full-text article views including HTML views, PDF and ePub downloads, according to the available data) and Abstracts Views on Vision4Press platform.
Data correspond to usage on the plateform after 2015. The current usage metrics is available 48-96 hours after online publication and is updated daily on week days.
Initial download of the metrics may take a while.