Fig. 3
Download original image
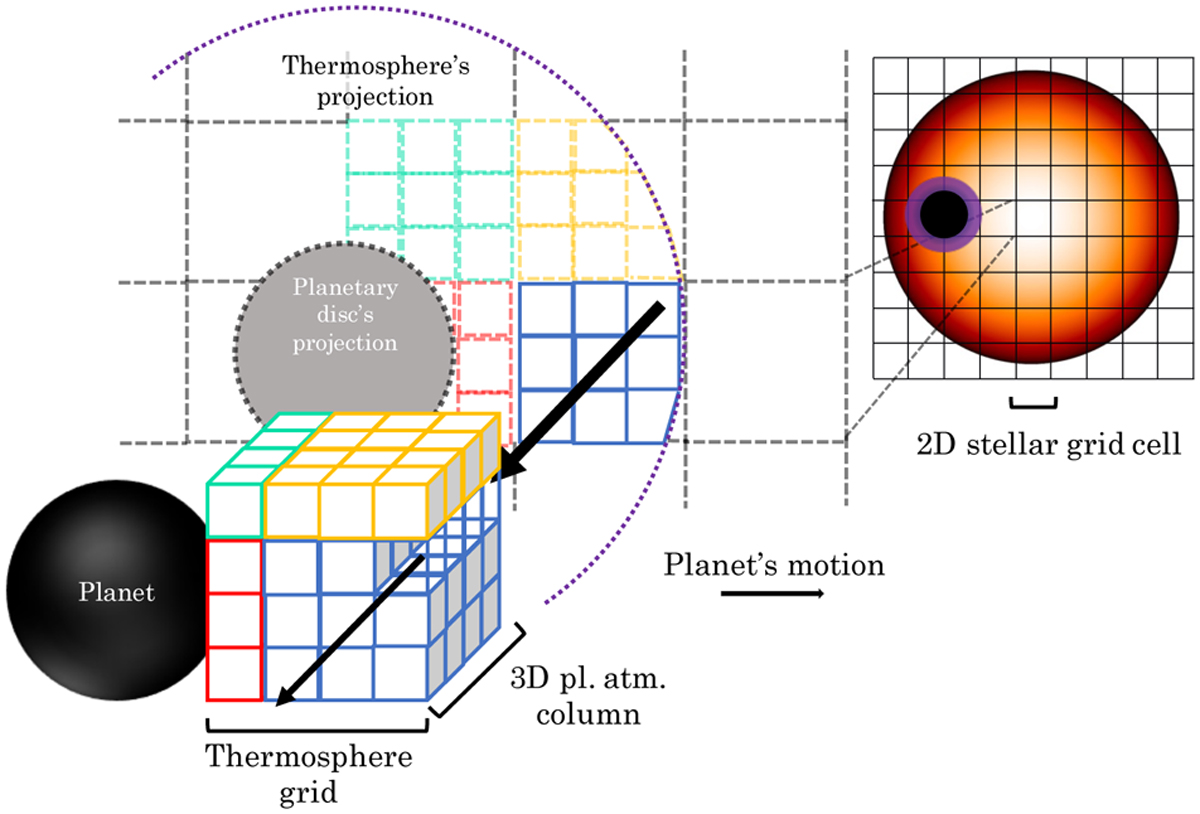
Simplified sketch of the code’s architecture for the computation of the absorption of the stellar spectrum during the transit of the planet and its atmosphere. Different colours for the thermosphere grid cells mean that their projections fall on different stellar cells. The black arrows represent the stellar light coming out of the stellar surface. We only show a small fraction of the simulated atmosphere for clarity.
Current usage metrics show cumulative count of Article Views (full-text article views including HTML views, PDF and ePub downloads, according to the available data) and Abstracts Views on Vision4Press platform.
Data correspond to usage on the plateform after 2015. The current usage metrics is available 48-96 hours after online publication and is updated daily on week days.
Initial download of the metrics may take a while.