Fig. 13
Download original image
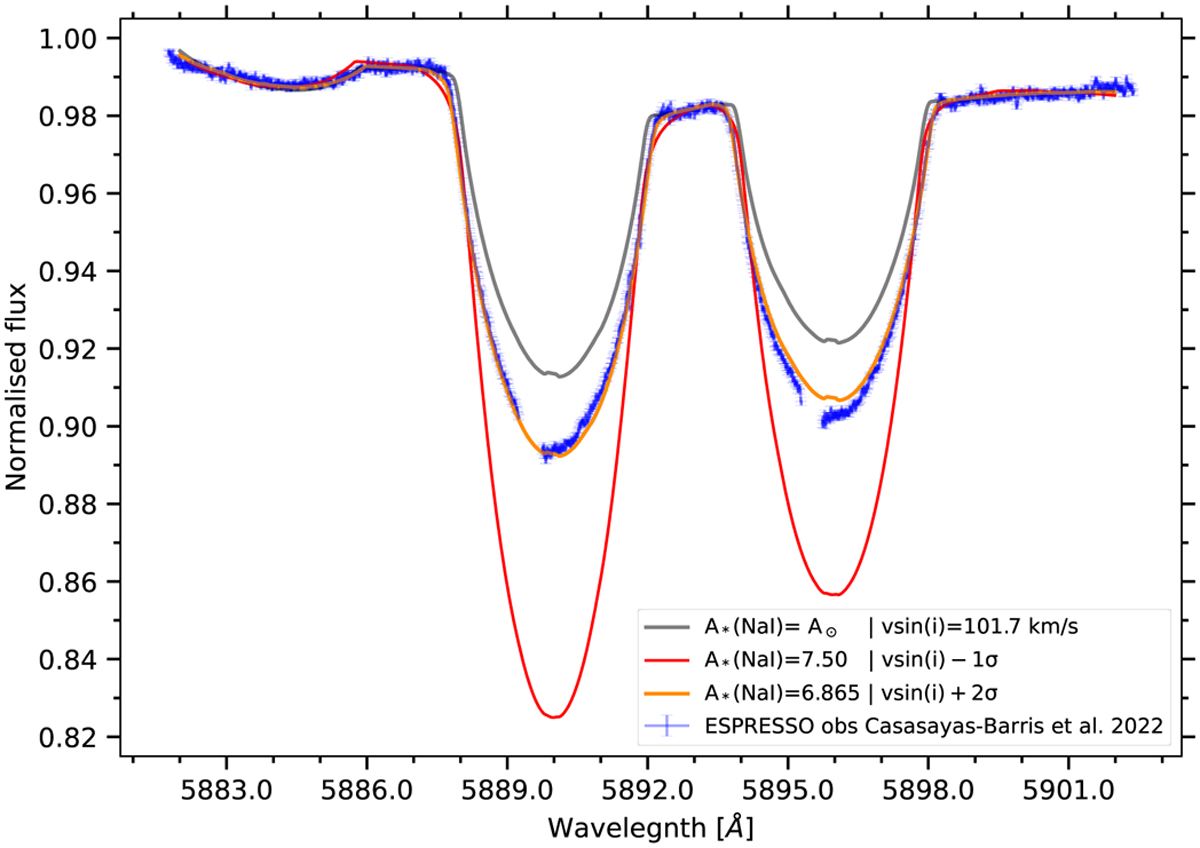
Observed and synthetic out-of-transit spectra of MASCARA-1. The grey profile shows Fout computed with the nominal literature parameters. The red profile shows Fout from the best-fit to the absorption spectrum including atmospheric sodium absorption (see middle panel of Fig. 12). The orange profile shows Fout derived for the best fit to the disc-integrated and absorption spectra.
Current usage metrics show cumulative count of Article Views (full-text article views including HTML views, PDF and ePub downloads, according to the available data) and Abstracts Views on Vision4Press platform.
Data correspond to usage on the plateform after 2015. The current usage metrics is available 48-96 hours after online publication and is updated daily on week days.
Initial download of the metrics may take a while.