Fig. 3
Download original image
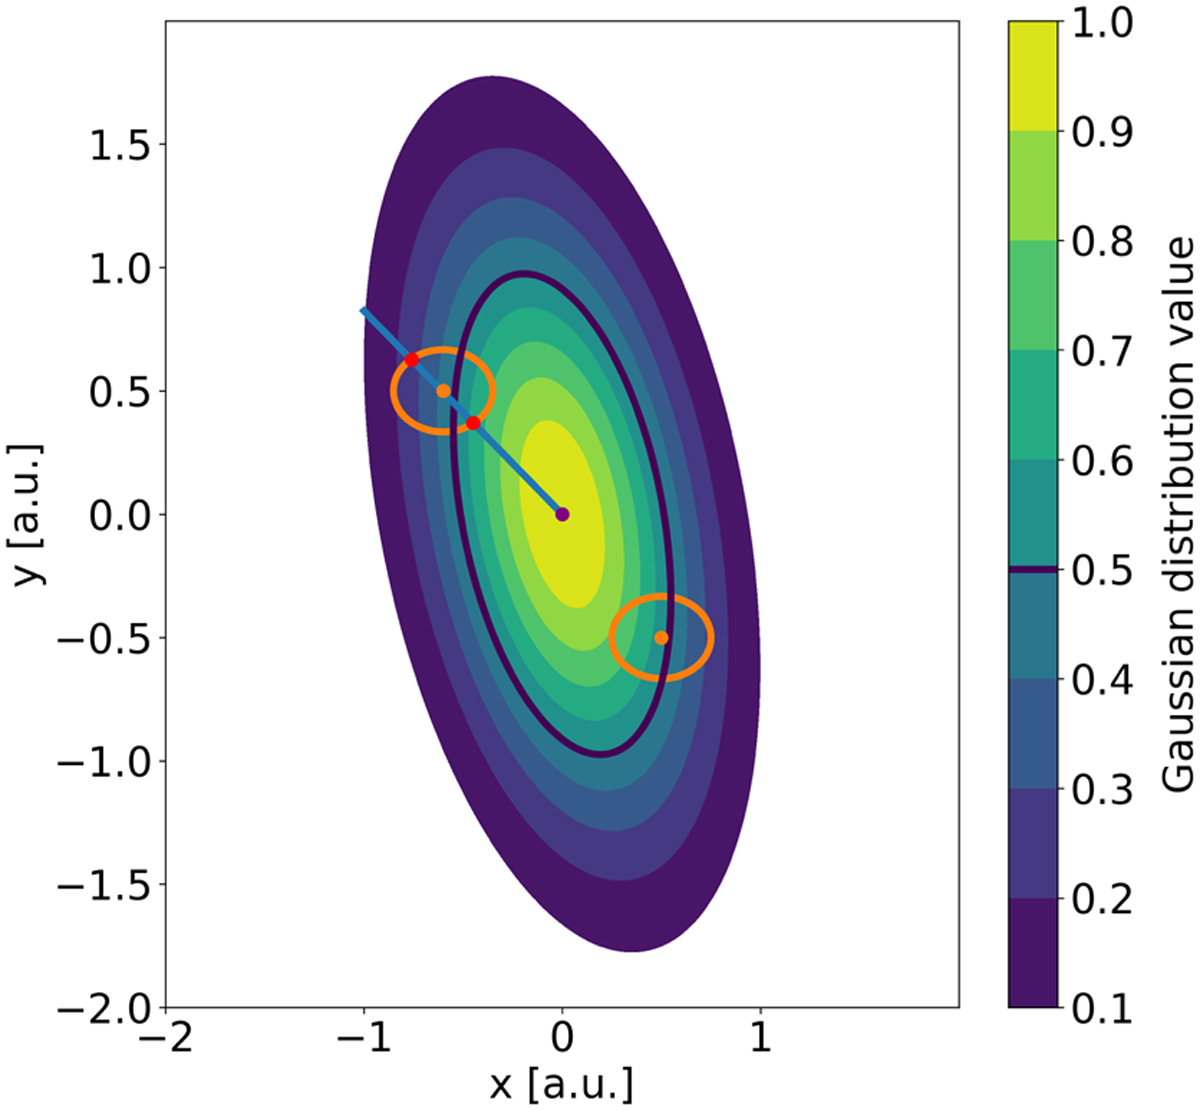
Sketch of three sources matching. The original (LoLSS) source in the middle is displayed as filled contours with its Gaussian distribution in 0.1 steps from 0 (minimum) to 1 (maximum). The potential counterpart sources are shown with their FWHM in orange. The blue line connects both centres and the red points are where the Gaussian value, υ, is additionally calculated.
Current usage metrics show cumulative count of Article Views (full-text article views including HTML views, PDF and ePub downloads, according to the available data) and Abstracts Views on Vision4Press platform.
Data correspond to usage on the plateform after 2015. The current usage metrics is available 48-96 hours after online publication and is updated daily on week days.
Initial download of the metrics may take a while.