Open Access
Fig. 17
Download original image
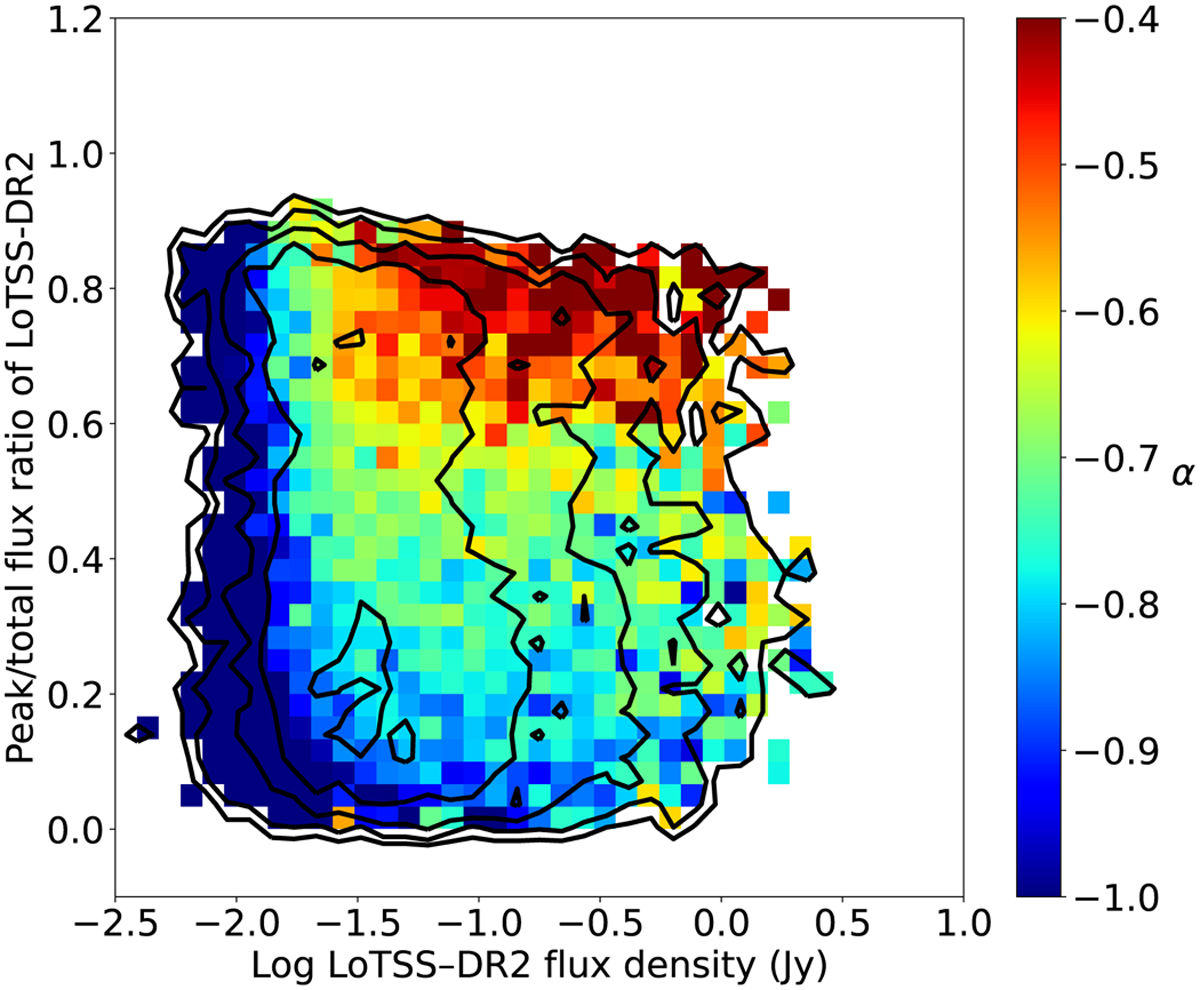
LoTSS-DR2 flux density plotted against peak-to-total flux ratio from LoTSS-DR2 with the spectral index to LoLSS as colour on the z-axis. The contours indicate the number counts at the 5, 10, 20, 40, and 80 levels.
Current usage metrics show cumulative count of Article Views (full-text article views including HTML views, PDF and ePub downloads, according to the available data) and Abstracts Views on Vision4Press platform.
Data correspond to usage on the plateform after 2015. The current usage metrics is available 48-96 hours after online publication and is updated daily on week days.
Initial download of the metrics may take a while.